Energymanagement
Heatmap
The heatmap is another evaluation function in ResMa®, which has been added in version 3.0. The heatmap is called up in the energy management section (additional package) via the entry “Heatmap” in the menu.
With the heat map, the value distribution of a numerical value over a period of time can be displayed in order to make e.g. particularly critical values visually easy to recognize.
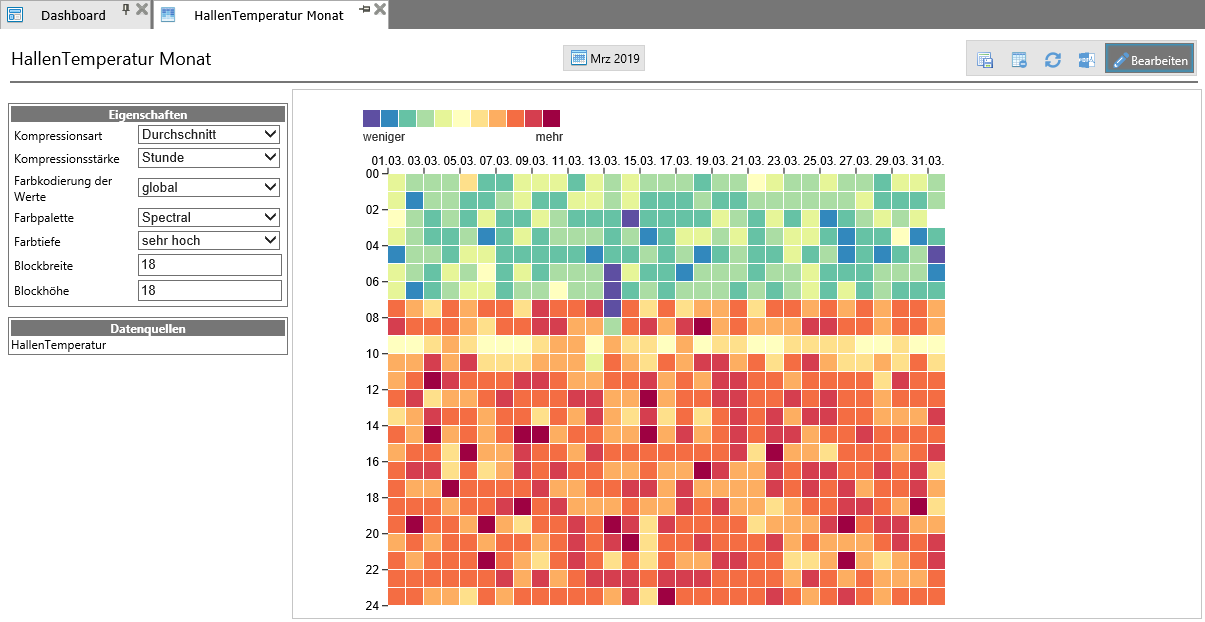
General settings for a heat map are made via the header bar. For the measured value, which is displayed in the heat map, some settings can be made for the display in edit mode.
Load analysis
The load analysis graphically represents the frequency distribution of the measured power of a meter. The bar chart was chosen as the display form. The performance values are combined into intervals and a bar is drawn for each interval, the height of which is a measure of frequency. All bars are the same width; the width does not encode any information, but only changes depending on the number of bars in the chart.
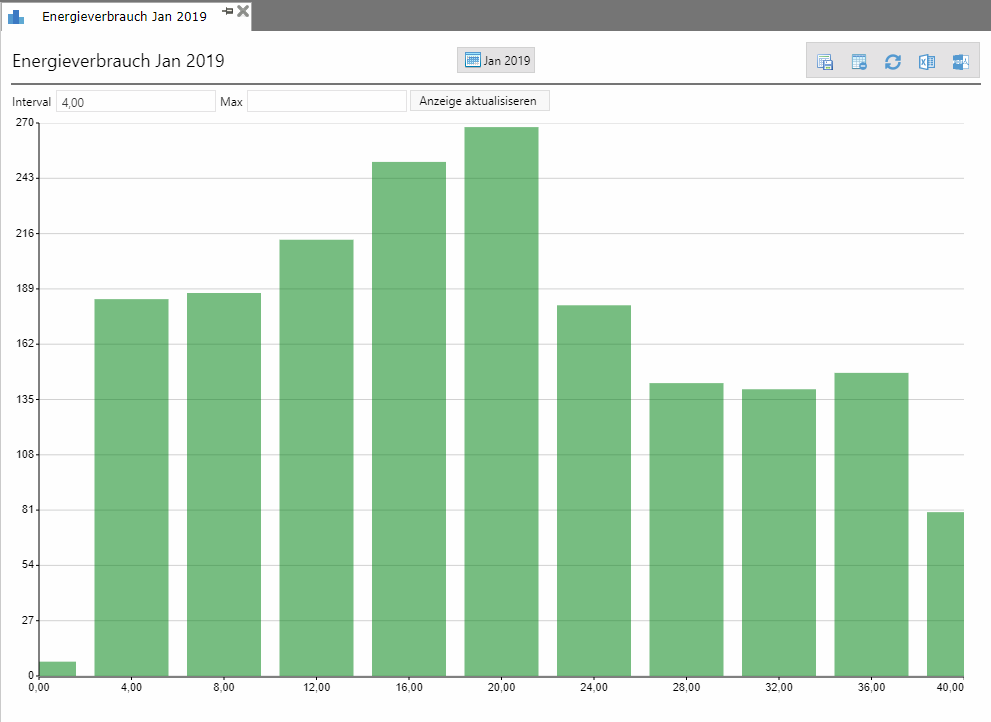
On the x-axis the measured power is removed, on the y-axis the frequency of the value. The resolution of the diagram can be configured using the “Interval” input field: the smaller the interval, the more bars are displayed (and the narrower the bars). By means of the input field “Max” the maximum value of the y-axis can be selected, e.g. to achieve a visually more pleasing result.
Resource Distribution
The resource distribution or the Sankey diagram is initially called via the resource view of the object tree. Then values can be displayed on any node within the “Resource View” via “Run Analysis” in the form of a Sankey diagram.

In edit mode via the right mouse button, “new nodes” can be created, which can also be moved to the desired position in the object tree afterwards. To do this, simply move the respective node to the desired position with the mouse button pressed.
Configuration Sankey-Diagram
Create new nodes
Via the edit mode, “new nodes” can be created for the existing energy media (electricity, gas, water > depending on what has been defined as the medium for meters) or existing nodes can be removed by “delete”. The aim is to build up a complete structure from the main energy meter EVU to the sub-distribution in the department to the last extraction point in order to gain the insight into how the energy used is distributed proportionally in individual sub-areas.
For this purpose, when creating a node, it is defined how the corresponding value for the ‘consumed’ media portion is to be determined there:
Consumption measurement: direct measurement by meter -> this is the only exact possibility with real measured values
Operating hours measurement: The state of a logical variable for on/off is extrapolated to a fixed assumed consumption value (is suitable for consumers with constant power such as .B room lighting)
Calculation: An assumed consumable value is evenly extrapolated over a number of operating hours per year (this corresponds to an estimated consumption assumption). Thus, such a value can only help to approximate ‘small’ measurement gaps via estimated values!

If a “new node” is created, it appears in the structure of the selected node directly below. If a node in the structure is to have a different position, it can be moved to any position in the structure by dragging and dropping. To do this, hold down the corresponding node with the left mouse button and drag it to the desired position.
Run analysis
Energy flow modeling allows the energy or media flows to be optimally analyzed within balancing groups. Any consumers can be selected in the object tree and the consumer evaluation can be started via the context menu. There is a hierarchical representation of the consumers in a table with all measured and calculated values.
Using the “Resources” => “Run Analysis” view, the energy flows are displayed in the form of a counter structure both as a table and as a Sankey diagram.

Within a balance area, the table shows the values for the runtime, the average output (purchase quantity) and the resulting energy value (or quantity value). Depending on the configuration of the consumer, the directly measured values are displayed in black font, all values calculated from them or calculated via the estimation formula are displayed in blue font.
The graphical evaluation with the help of a Sankey diagram shows the percentage of individual sub-areas graphically. This makes it possible to quickly identify large consumers and gain insight into where the installation of additional measurement technology makes sense.
The difference indicator allows a simple plausibility check of the recorded or determined values. With continuous measurement of a branch, only measurement errors and line losses that are typically less than 5% may occur. Larger deviations show that determined values (assumptions about runtime and typical power consumption) are incorrect or that the correct counters are not assigned.
Of course, all meters or reference values must be provided with the same unit!
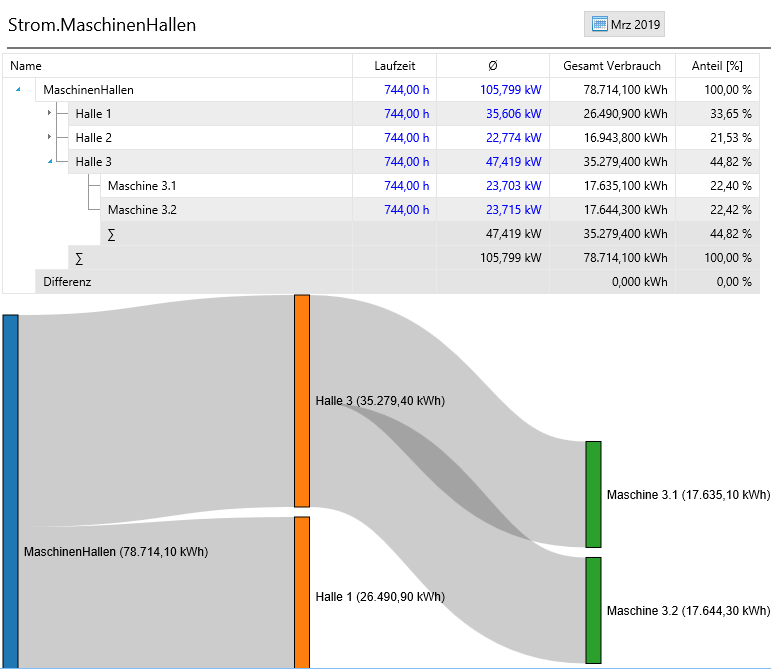
The general operation of the Sankey is carried out via the header bar. In addition to the standard functions, the views can be switched.
PDCA Cycles
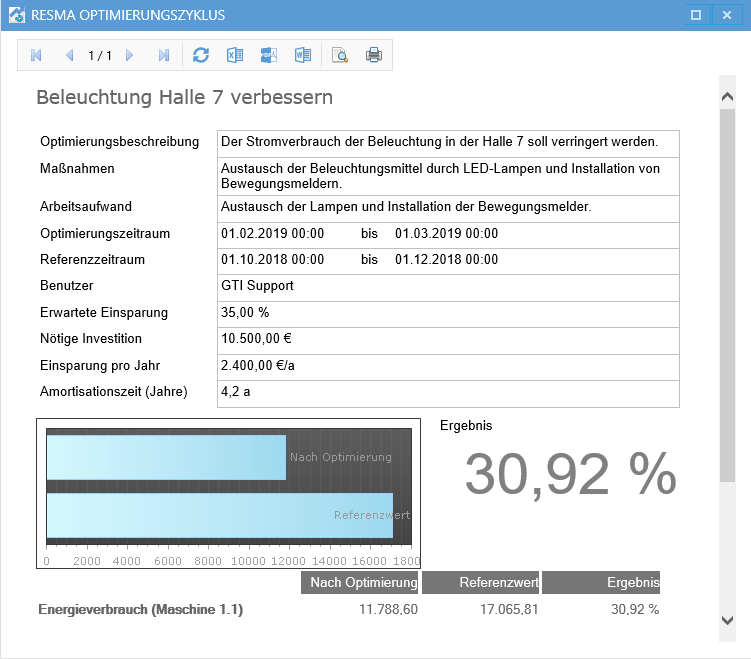
The optimization measures for the energy management system are defined, documented and evaluated as PDCA cycles. Any number of measures can be defined and managed here. The individual measures are presented in an overview to provide a quick overview.

Definition PDCA Cycles
The optimization measures for the energy management system are defined, documented and evaluated as PDCA cycles. Any number of measures can be defined and managed here. The individual measures are presented in an overview to provide a quick overview.
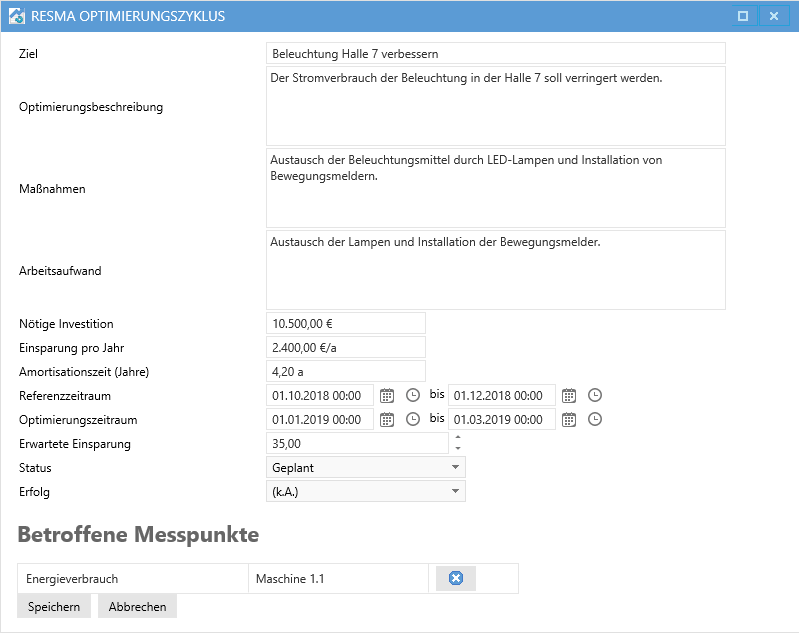
The status can be scheduled, active, or completed. The success is also documented.
Measurement PDCA-Cycles
With the evaluation button, the success of the optimization measure can be evaluated directly.
