Monitoring
The Monitoring area contains all important basic functions for monitoring processes and managing the required data points.
Object Tree Views
In ResMa®, views are tree representations of the existing system from different points of view. A total of four different views can be used:
Standard: The process/asset view you model
Connector: all connectors and the data points configured by them
Resources: Energy Management: Energy Flow View
Cost Centers: Measurements/Counters in a Cost Center Structure
All these views can be selected from a drop-down menu at the top of the views pane. Next to it are two buttons. The left refreshes the tree view. The right switches from the normal view to the editor mode. Below this bar is a filter line. This filter affects all measurement points within the displayed tree. The filter criterion contains is used. This means that every measuring point containing the entered text is displayed. Each view sets up an independent tree structure. Depending on the status, the individual structure elements can be provided with state icons. If such an icon is displayed, a corresponding tooltip can be called up via a mouse over. this tooltip displays information about the state.

Default view
In the default view, the user receives an image of his branch structure. This can consist of one branch or several. Such a branch may correspond to the structure of the represented production facility. This can be structured tree-like and goes over all desired levels up to the subordinate measuring point.

To build the structure, consumer elements are available to the user. To manipulate the tree structure, it is necessary to switch to editor mode. This gives you access to the corresponding elements to expand the structure. The editor mode can be reached by clicking on the button with the pencil icon. This mode can be restricted by rights. An active editor mode can be recognized by the fact that the background of the view turns different and the pencil icon changes to an eye icon.
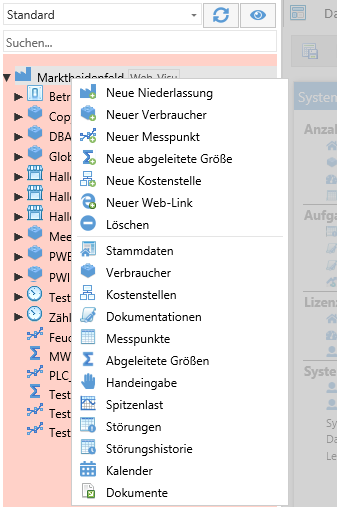
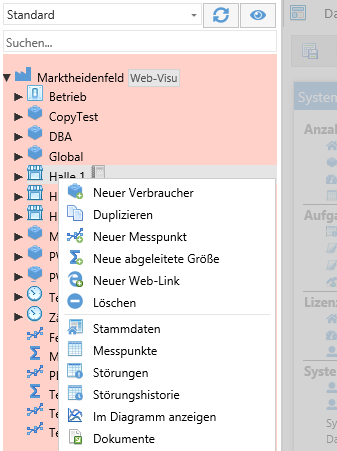
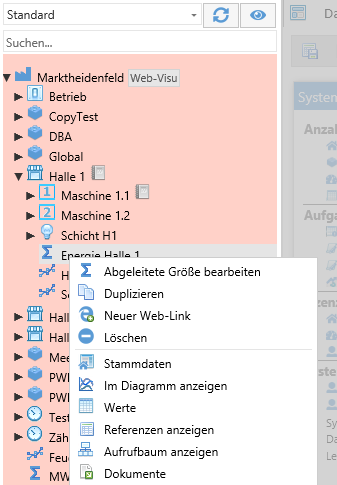
To insert new elements, the context menu must first be called on the corresponding node under which elements are to be inserted. This frees up a selection of various elements.
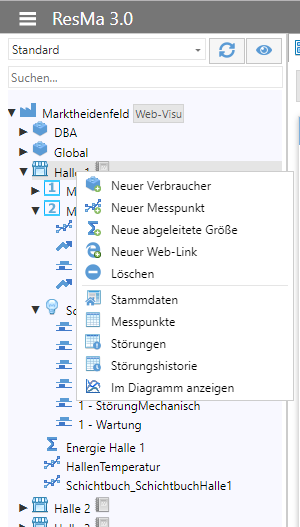
The following elements can be created depending on the structure node:
New branch (only when accessing the context menu on a branch office)
New consumer (not in the connector view)
New measuring point
New derived value
New cost centers (only when calling up the context menu on a branch office)
New web link
Delete
To create a subnode, you have to add a new consumer to the tree. Clicking on ‘New branch’ or ‘New consumer’ opens a dialog, which must be filled in with the corresponding information. Individual nodes can be moved by drag & drop.
Consumers stand as placeholders for any outline points. They are used to model the desired hierarchical structure of the object tree. Via the naming and individually assigned icons you can influence the design.
In the context of evaluations, consumers can be used as filters or grouping elements. In connection with the order-oriented evaluation, all data points of a consumer are recorded at the beginning and end of an order, regardless of the set logger interval.
Connector view
Under the Connectors view you can see all connectors that are assigned to a branch office. All assigned measuring points are attached to a connector. In the case of a DirectConnector, all individual connections must be viewed as intermediate structures.
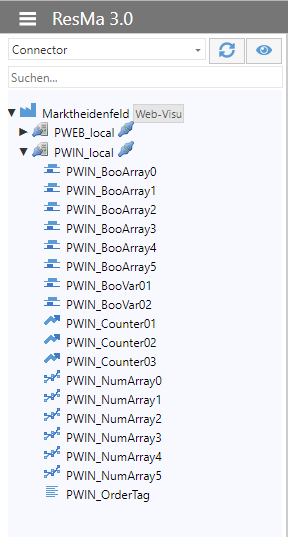
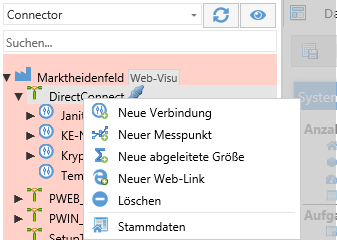
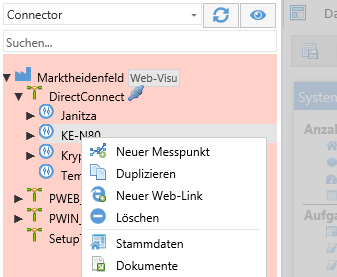
The editor mode must be called equivalent to the standard view on the corresponding connector. after that the user can insert the following items:
New connection
New measuring point
New derived value
New web link
Delete

A fastener element can be inserted here as a structure element. However, this does not apply to the Modbus connector.
Resource view
The resource view is used to configure media flows in order to be able to evaluate them via Sankey or table. This view therefore offers the possibility to configure the distribution to the assigned consumers for each used medium (defined by assigning a counter to a medium).
Example: Main power connection -> sub-distribution 1-x -> machine/consumer 1-n
Typically, each branch is assigned its own measured value (counter) or alternatively the calculation of a replacement value.
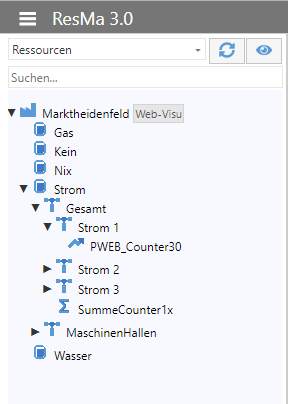
The editor mode must be called equivalent to the standard view on the corresponding medium. after that the user can insert the following items:
New node
New web link
Delete

As in the other views, a structure can also be entered here. This structure is built via nodes. These nodes must be provided with the required information via a dialog.
Cost Center View
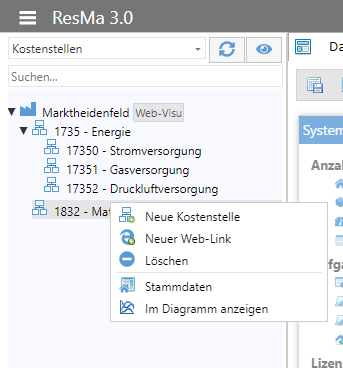
In the fourth view ‘Cost Centers’, the user can map the cost center structure of his company. To create the corresponding structure, the same procedure applies as for all other views. New cost centers can be created via the editor mode. The depth of this structure is not limited.
Master data
Master data is basic information about an element. Each element in a tree structure has this entry in its context menu. Clicking on the entry ‘Master Data’ opens an element-specific dialog that displays the basic data of this element and releases it for modification. Which of these fields you have to enter is element-specific and is indicated by a message after saving.

In the following chapters, all master data are discussed, which will not be described in more detail in the coming chapters.
Master data location
The master data of a branch office (a location) can be accessed via the context menu.
The following items are available in the standard:
Name: textual input field (required)
Country code: Selection box
Attention
If a required country is not included, it can be added to the country menu. Menu path: System –> Countries
External ID: numeric input field
ZIP: numeric input field
Location: textual input field
Street: textual input field
State: textual input field
Area code: numeric input field for the country code
Telephone number
The Area User defined attributes is described in chapter 1.5.
Master data consumer
The master data of a consumer can be accessed via the context menu.
The following items are available in the standard:
Name: textual input field (required)
Comment: textual input field
Custom icon: Selection list of ready-made icons
Attention
Do you want to use your own icons? Please contact our ResMa®-Support (ResMa@gti.de).
Master data resource node
The master data of a resource node can be accessed via the context menu.
The following items are available in the standard:
Medium (comes automatically via the parent resource)
Name: textual input field (required)
Custom icon: Selection list of ready-made icons (see Chapter 1.2.)
Max. power: numeric input field
Feed-in: Checkbox
Consumption measurement: Selection list of all meter values with the assigned medium
Operating hours measurement: Selection list of all logical measuring points
Calculation:
Duration per year: numeric input field
Average performance: numeric input field
Unit: Selection list of all units known in the system

A more detailed description of the individual entries can be found in the chapter ‘Resource distribution’.
Master data cost center
The master data of a cost center can be accessed via the context menu.
The following items are available in the standard:
Number: textual input field
Name: textual input field
Custom icon: Selection list of ready-made icons (see Chapter 1.2.)
Master data measuring point
The master data of a measuring point can be accessed via the context menu.
General master data
A measuring point can be created of the type actual value, setpoint value or counter value. A measuring point of the type “Derived Value” can be created using the functionality of the same name.
For (media) counters of any type, the type Counter Value should be selected. This makes it possible to log the meter readings in addition to the performance data.
Actual values, on the other hand, only know exactly one value at a certain point in time.
Target values can be used to set process values.
Measuring point ID
The measurement point ID represents a unique identifier of the measuring point within a ResMa® installation. With it, it is possible to transfer measuring points with the same ID to another ResMa® installation. The measuring point ID is typically a language-neutral identifier such as e.g. V027-E12 (license plate key)
The measuring point ID is used as an internal reference and is suitable for a transfer to another installation as a unique identifier.
Display name
The display name is language-dependent and is used to display the value depending on the currently selected language in the object tree and user interfaces.
To change a display name depending on the language, the system must first be changed to the desired language. You can then change the display name for the active language.
When switching the languages, the display name now also changes accordingly in user interfaces.
Class
By assigning class names, it is possible to create derived (calculated) values (e.g. KPIs) in such a way that they automatically appear on all possible instances.
Example: In the object tree, several machines are created as consumers and they all have a piece counter and an energy meter, then a calculated quantity of energy per piece could be created in which the class names are used. Even if the data points have different designations, the KPI would still be created and calculated for all machines.
Unit
Selection of the measuring unit of the measuring point. This has, for example, influence on the axes in the diagram or the unit display in thereport. The unit list can be extended as desired via the system settings.
Cost center
As soon as a cost center has been defined, it is available in the “Cost Centers” tree view. By grouping them into cost centers, all stored measuring points can be displayed in a diagram, for example via the context menu of the cost center.
Consumer
Consumers provide logical outline levels for the object tree. Specifically, the higher-level consumer is stored in the object tree. However, measuring points can also be conveniently reorganized via drag & drop in the object tree.
Order reference – batch-oriented collection of data
All measuring points of the data type STRING can be defined as order reference. As soon as the value of this STRING measuring point changes, the value of this measuring point is also written acyclically, regardless of what is defined as the sampling interval.
This is necessary in order to be able to create order-related evaluations with a clear demarcation of values at the beginning and end of the order.
The corresponding order reference can be selected in the report for evaluation purposes.
Factor
The factor is used in particular for counters, when values are to be transferred directly factored into the database during data collection. This eliminates the need for a later conversion at the evaluation level. For example, pulse counters or converter counters often have a weighting factor of 10/100/1000 kWh per pulse/count.
Validity check
Plausibility checks can be configured and named in the system settings. Here, these tests can be connected to a measuring point so that the test is applied accordingly and, for example, alarms associated with the test can be triggered.
Connector
This is where the data connection is configured. Depending on the system structure, various options are available:
No logging. The measuring point is not logged automatically but via manual input. Only with this connector setting can measurement points be used in the manual input.
DirectConnect:Connection via Modbus TCP or Modbus RTU.
PROCON-WEB: Connection via PROCON-WEB project.
PROCON-WIN: Connection via PROCON-WIN project.
Specific master data for actual values/setpoints
Data type
Select the type of data to record.
Min-Value
Minimum value that cannot be undercut for manual inputs. It is not possible to save the values in the input mask if they are not reached.
Max-Value
Maximum value that cannot be exceeded for manual inputs. It is not possible to save the values in the input mask if they are exceeded.
Specific Master data for meter values
Medium
Here you can specify the medium or resource that is being counted. In addition, an already created resource can be selected via the drop-down menu.
As soon as a resource is stored in a measuring point, it is automatically available in the object tree in the “Resources” view.
Measuring point monitors
Measuring points can be linked to alarms using a measuring point monitor. The data that is periodically read in by the connector according to the configured pick-up interval is checked. If a value is outside the interval defined by Min/Max, an alarm is triggered.
Note
The checking of the measuring point monitor always takes place only when the data is read in from the connector. For example, this always happens on the hour. Thus, the alarms are triggered accordingly delayed. Manual input values are not taken into account. These can be regulated by specifying a maximum and minimum value in the master data.
Configuration of a measuring point monitor
Name
Freely assignable name of the measuring point monitor
Min
Minimum value that is still valid
Max
Maximum value that is still valid
Alarm
Selection of a previously created alarm
Days / Calendar Category / Time
Time limitations for the application of a measuring point monitor
Measuring point monitors for Boolean measuring points
A measuring point monitor for logical (BOOL) values can also be defined.
Here, only two settings for triggering are useful. A trigger when switching to 1 or 0. The two scenarios are briefly described below and an exemplary configuration is shown.
As soon as the value changes to 1/0, a corresponding alarm is triggered.


Low/High-Alert
Copy value to
The value of a variable can also be written back into the process via the connector. This can especially make sense with derived values.

Parameters for this are the connector to be written to (not all connectors support this feature!), the tag to be written to and a type, which value should be written.
Dashboard
General
The dashboard is a page in ResMa® that can be individually designed by each user. It can be equipped with the following elements:
System statistics
Disturbances
My documentation
Active PDCA cycles
Existing profiles
Diagrams
All inserted elements are automatically arranged grid-oriented and provided with a standard size. Both size and position can be subsequently adjusted by the user.
The dashboard can be reached via the corresponding navigation point.
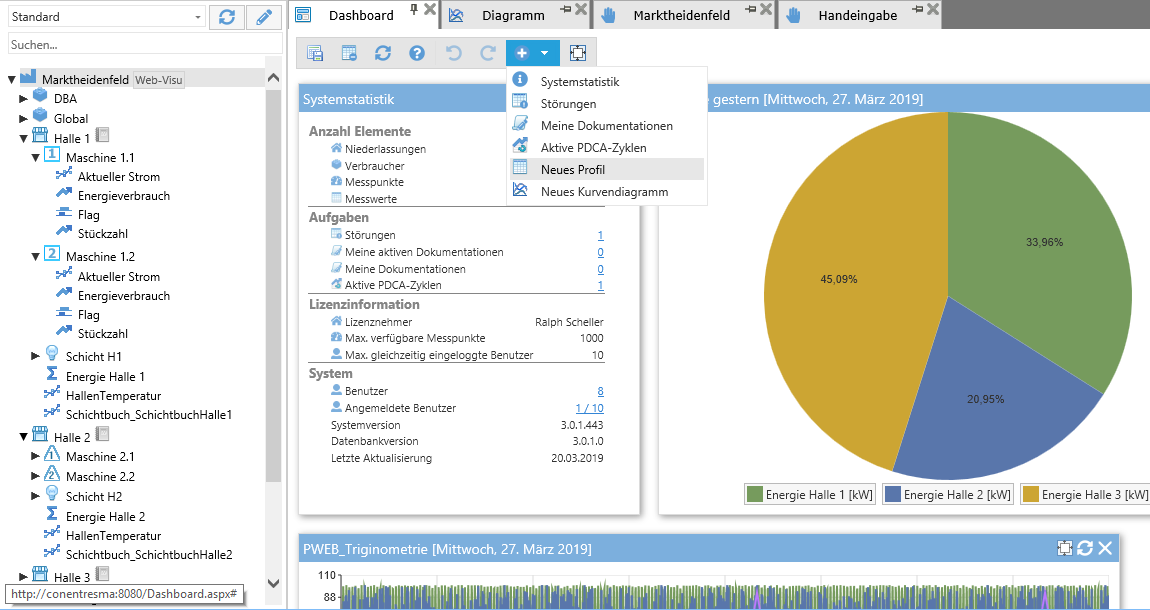
Compilation Dashboard
Toolbar
By default, the toolbar is located in the upper-left corner of the tab. However, it can be positioned individually. The toolbar contains the following elements from left to right:
Reset View: Clears the current dashboard. All items are deleted.
Refresh: Updates all items of the dashboard
Help: Displays a help/explanation of the dashboard
Undo: Undo the last step
Redo: Takes the last step back
Add: Item list of items to add
Full screen: The dashboard is displayed as a full screen
Item: New Profile
Since ResMa® 3.0, any saved profile can be included as an element in the dashboard. This means that all display APPs are available as an element in the dashboard and do not have to be recreated for this purpose.
At the beginning, if not many profiles have been created yet, this window may also have fewer entries.
Item: System Statistics
The System Statistics element shows a view of the current ResMa® system data. In addition to statistics from the currently running system, data on the license and its utilization are also displayed.
The following statistics are displayed by grouping:
Number of elements
Number of branches
Number of consumers
Number of measuring points created in relation to the maximum
Number of measured values recorded
Tasks
Number of currently pending alerts
Number of active user-specific documentation
Number of user-specific documentation
Number of active PDCA cycles
License information
Name of the licensee
Number of maximum available measuring points (Each value that can be evaluated via ResMa® counts as a measuring point)
Number of users who can log on to the ResMa® system at the same time
System
Number of users created in the system
Number of users currently logged on to the system
System version
Database version
Date of last update
All entries whose data is underlined are linked to the respective detail tab via a hyperlink. This means, for example, if you press the number of branches, the list of all branches is displayed. The other links provide similar quick links to the respective context-specific pages.
Item: Alerts
The alert element generates a list of all currently pending alerts of the ResMa® system in the dashboard. All entries are displayed with an alarm text and the assigned branch.
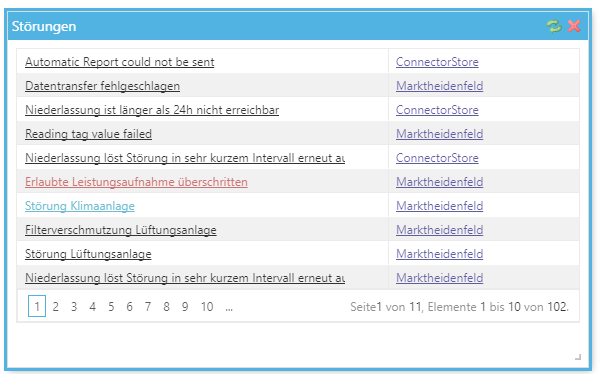
Both the alarm text and the branches are clickable. Clicking on the alarm text opens a detailed dialog for the current alarm.
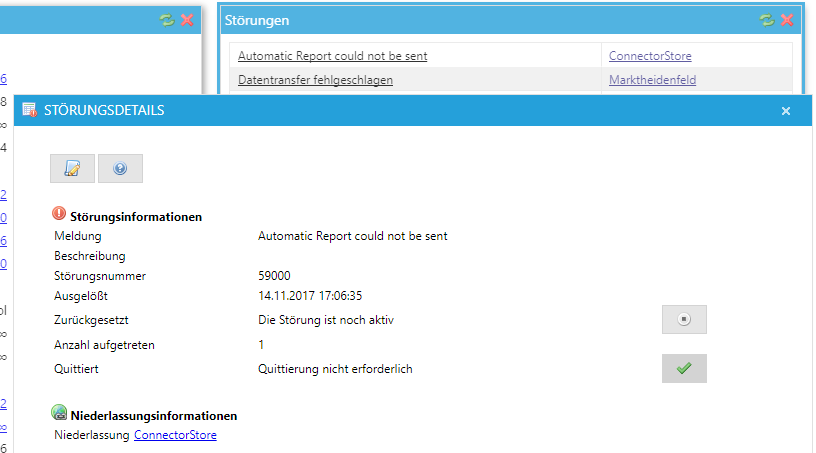
Alert information can be viewed here. Furthermore, if there is sufficient authorization, it is possible to acknowledge and/or reset the alarm. This open alarm can also be stored in ResMa® as documentation if measures have to be taken in this regard that should be documented. All these functions can be triggered via the displayed buttons. If you click on the link under Branch in this dialog, the branch office is marked in the project tree. The same function is hidden behind the click on the branch in the alert list.
Item: My Documentation
The My Documentation item displays all user-specific documentation.
The items displayed are again links. As in the event of a malfunction, these call up a specific detail dialog.
Here the user gets the current status of the problem and all the information that has been documented in this regard. Other entries can also be written.
Item: Active PDCA Cycles
The Active PDCA Cycles element displayed a list of all PDCA cycles. In addition to the cycle name, the current status is also displayed as an icon.
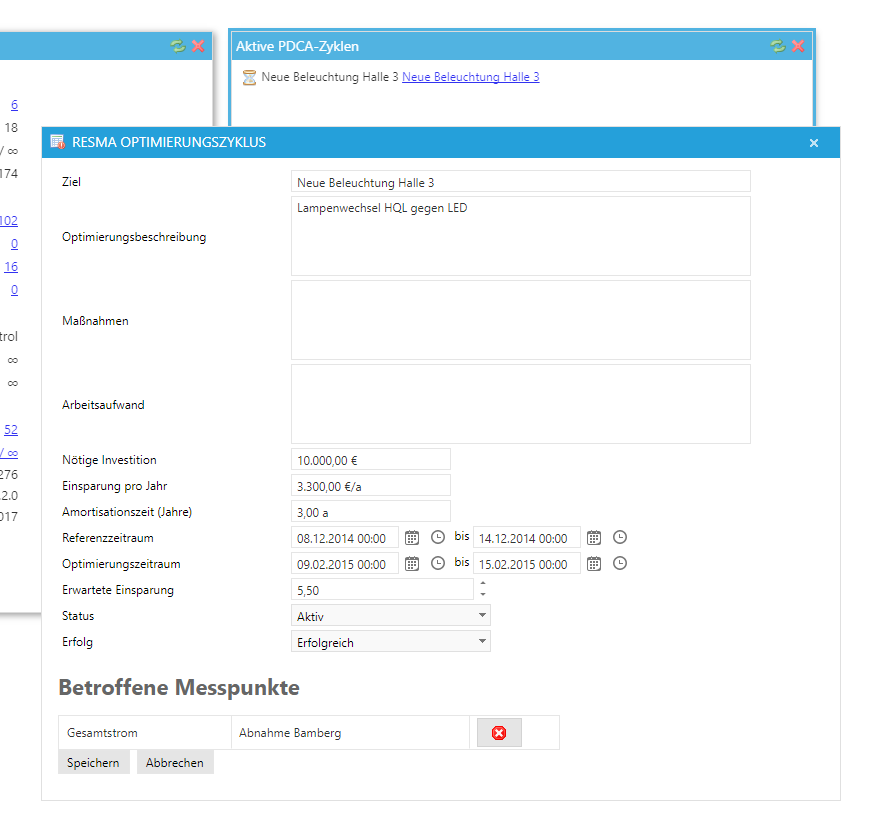
Again, you will find a link to a detailed dialog to view the PDCA cycle as a whole.
Here the user sees all the information about the specific PDCA cycle. Depending on the authorization, this can also be adapted or updated.
Item: New Chart
The New Chart element creates a configurable chart in the dashboard that can be filled by the customer with the desired measurement points.
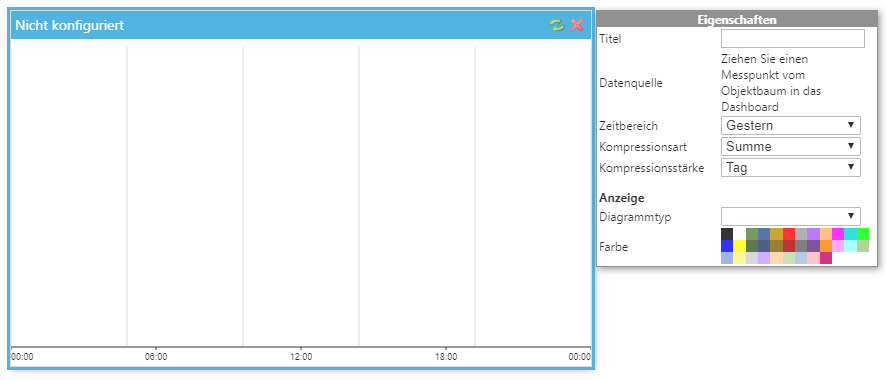
Next to the later diagram is the configuration unit. This can be used to set up the view. The following parameters must be adjusted for the diagram:
Title: Chart View Title
Data source: Measuring point(s) to be displayed. These are dragged and dropped directly into the diagram by the project tree
Time range: Choice from multiple time ranges
Compression type: Choice of several compression types
Compression strength: Choice of multiple compression strengths
Chart Type: Choosing from Multiple Chart Types
Color: Selecting the curve color
If more than one measuring point is provided for the diagram, additional elements are shown and the color is hidden. The additional elements refer to min/max values related to the y-axis of the measuring points.
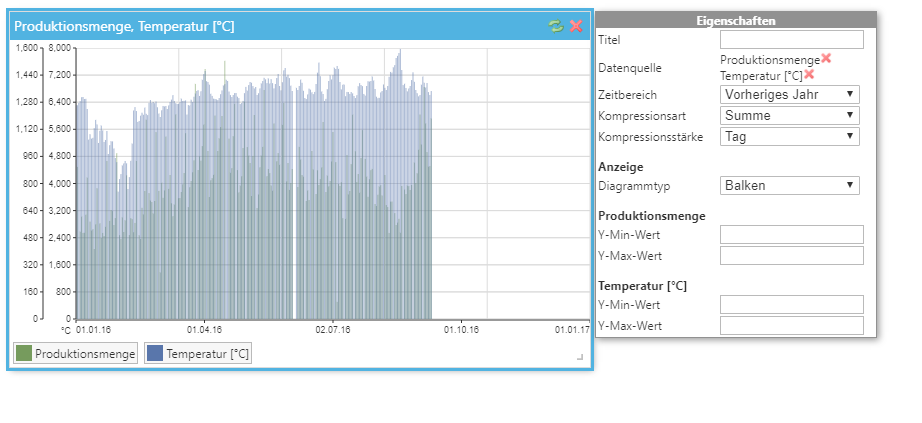
The drop-down menus are explained in more detail below
Time range
Under Time range, the user can select a relative evaluation period.
Type of compression
The compression type determines how the values are to be displayed in relation to the set compression strength
Compression strength
Under Compression Strength, a period of time can be selected over which data is summarized. This period is decisive for the calculation of the diagram value via the set compression type.
Chart type
The chart type is about the representation of the curves in the chart. Only one display type can be selected here, which then applies to all curves.
Live-Monitor
With the live monitor, graphical representations can be created to visualize measured values live.
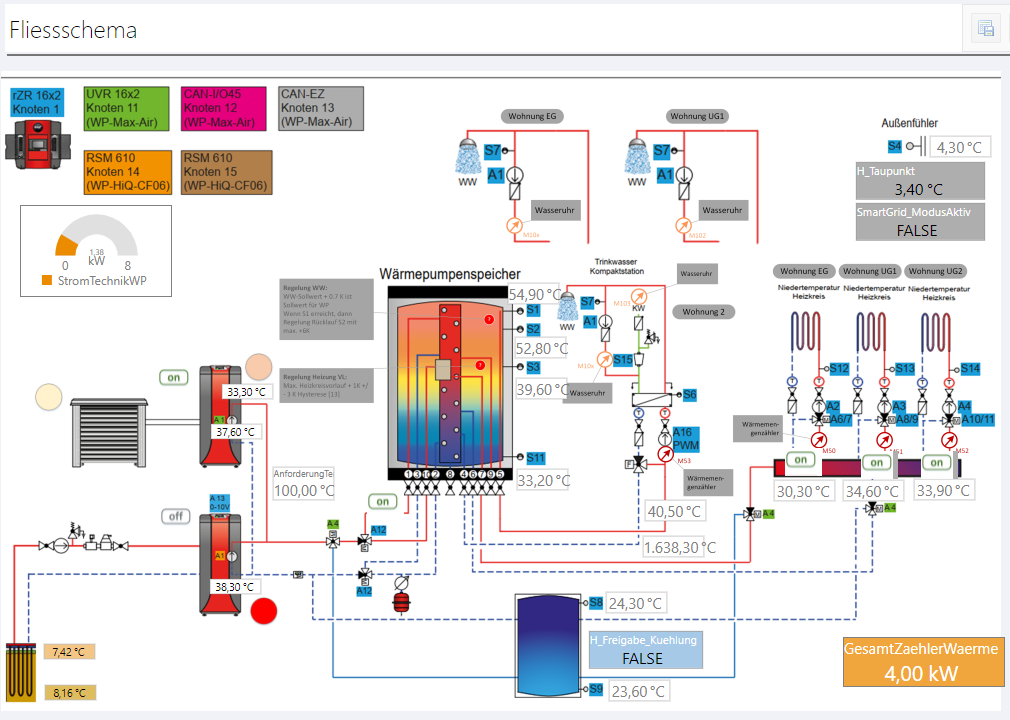
The live monitor is accessed via the Live Monitor entry in the monitoring menu.
Operating the Live Monitor
The general settings for the live monitor are made via the header bar.

These include:
Save current view as profile. The current view is saved as a profile with all settings (-> see also Profiles)
Reset current view The live monitor reverts to a blank view
Transfer formatTransfer format to another element
UpdatingThe live monitor is updated, any values received in the meantime are also displayed
Create direct linkCreate a web link to navigate directly to a specific live monitor
Export to a PDF fileThe view of the live monitor is exported as a PDF
HelpLive Monitor Online Help
EditingSwitching between Edit and View modes
Settings Live Monitor
For the setting of the live monitor and the display of the measured values, the following options are available in edit mode:
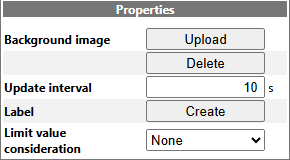
- Properties
Background image: Allows you to upload and delete an image as a background.
Update interval: Specifies the time interval in seconds at which the data is requested and updated.
Label: Creates a configurable label in the measurement points window.
Limit value consideration: Specifies which limit value consideration should be used. Either the min/max values of the master data for a measuring point are used as limit values, or no limit value check is performed when the values are saved.
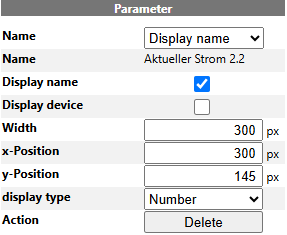
- Parameter
Name: Specifies how the measuring point name should be displayed. The normal display name, the measuring point ID, or a freely selectable entry.
Name: Display or input field for the name.
Show name: Shows or hides the measurement point name.
Display unit: Displays the unit of the measuring point that was stored in the master data dialog.
Display device: In addition to the measurement point name, also displays the consumer.
Width: Specifies the width of the measurement point element in pixels.
X position: Shows the X-axis coordinate point of the measurement point element in pixels.
Y position: Shows the Y-axis coordinate point of the measurement point element in pixels.
Display: Specifies the display format of the measurement point element (e.g., dial gauge, drop-down menu, etc.).
Action: Deletes the selected measurement point from LiveMonitor.
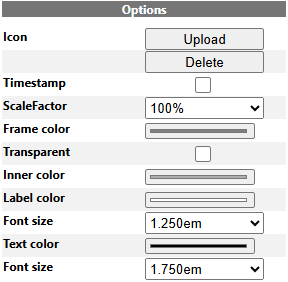
- Options
Icon: Allows you to upload or delete an icon.
Timestamp: Displays the timestamp on the measurement point element.
Scaling: Specifies how large the measuring point element is displayed.
Frame color: Specifies the frame color of the measurement point element.
Transparent: Specifies whether the background of the element should be transparent or not.
Inner color: Specifies the background color of the name/unit area of the measurement point element.
Label color: Specifies the font color of the measurement point element.
Font size: Specifies the font size.
Text color: Specifies the color of the text in the value field
Parameter
These are the default settings for a measurement point. They influence the display of the selected input field. The Delete action can be used to remove the field from the live monitor.
The value representation generally regulates the visualization of the value. The Options area depends on the selected display type and is explained in the context of the respective display type.
Copy format
With the system, the user can conveniently transfer formatting of one measuring point to another measuring point without having to set the parameters individually again.
This format transfer works via a brush function, as many users are used to from Office products. A brush button is integrated into the PageTools.
Requirements:
Format transfer can only be activated in edit mode.
Functionality:
Select item whose formatting should be transferred
Start transfer via toolbar button or F9
Select the element to which the format is to be transferred
Display options (Controls)
The visualization is controlled by the Display field and can be selected as follows, depending on the data type to be displayed:
Numeric values can be represented as
Number
Dial gauge
Texts can be represented as
Text
Logical values can be represented as
Value display static
Value display dynamic
Value display dynamic (icon only)
Value display dynamically (text only)
Value table
The values of a measuring point stored in the database can be displayed and also changed via the value table. The value table is called up via the burger menu or the context menu of a measuring point, among other things.
Depending on the type of measuring point (actual value or counter reading), the table is structured in two or three columns.
Note
Only one measuring point can be displayed in the value table at a time!
Operating the value table
The value table is operated via the control bar.

These include:
Save current view as profile. The current view is saved as a profile with all settings (-> see also Profiles)
Reset current view The value table reverts to an empty default view
Refresh The view is refreshed, in the meantime newly recorded values are displayed with
Export as Excel file The values are exported to an Excel file
Save as PDF file The value table is exported as PDF
Help Online help for the value table
Temporal grouping selection of temporal grouping
Changing Values Calling a Value Change Dialog (-> see Manipulating Values)
Enter values Calling a dialog for entering values (-> see Manipulating Values)
Find outliers Call a dialog to find extreme values
In addition, the display of the table can be adjusted via the footer.

These include:
Scroll between the displayed pages
Number of items number of rows displayed per page
Number of values next to each otherNumber of values displayed in a row
Change or enter values
Via the value table you have the possibility to change existing values or to enter new values manually.
The “Change Values” dialog allows you to manipulate a single value or a whole series of values within an interval. This allows values that have been entered incorrectly to be corrected or deleted.
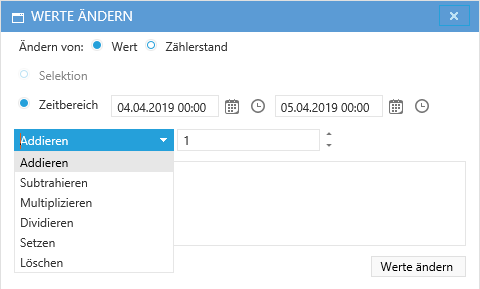
In addition, you can optionally enter a comment here that justifies the change in value. The manipulated values are highlighted in color in the value table, the comment is displayed when the mouse is moved over. The system continues to store the original values to allow tracking of manual changes. With the comment, references to the reason for the change such as ‘Weighting factor set incorrectly’ or ‘Sensor defective’ can be stored.

Via the dialog „Enter values“ you can enter new values with an associated time stamp.
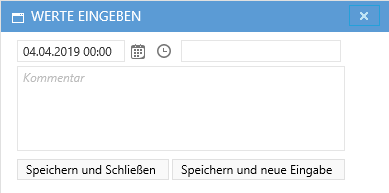
Here, too, you can optionally enter a comment that justifies the value entry. The entered values are stored in color in the value table, the comment is displayed when moving over with the mouse.

Measuring points
The measuring point table (measuring point grid) can be used to display all measuring points of a branch or a consumer at a glance. The call is made either via the context menu of the consumer or the branch or via the burger menu (APP selection).
Operation measuring points
General settings for the measuring point grid are made via the header bar.

These include:
Reset current view: The metering point grid is reset to the devault view
Show advanced filter: Display of an extended filter line for the measuring point grid
Show Grouping Row: Show a Grouping Row for the Measurement Point Grid
Update: The chart is updated, any values received in the meantime are displayed
Export to an Excel file: The measuring point grid is exported to an Excel file
Export to a PDF file: The measuring point grid is exported to a PDF file
Help: Online help for the measuring point grid
Apply setpoints from: Imposes the setpoints from another branch
Request Data: Requests the current data from the associated connectors
Import data: Imports data from an Excel or .CSV file to ResMa®
Export measuring points: Exports the definition of the measuring points into an Excel file, e.g. to import them to another branch or to obtain a template for external processing of mass data
Import measuring points: Imports the definition of the measuring points from an Excel file
Column definition: This can be used to customize the column definition of the measuring point grid
Import and export functions
Import data
Measured values can be imported from files via the measuring point grid. CSV (.csv) and Excel (.xls, .xlsx) file formats are supported in a specific format:
CSV file
Note: CSV files can only be imported via the Data Import Service.
The semicolon must be used as a separator. The first row contains the column names. The first column must contain a time value, the rest of the data are floating-point numbers (float, real).

Excel file
Die erste Mappe muss die zu importierenden Daten enthalten. Wie beim CSV-Dateiformat stehen auch hier in der ersten Zeile die Spaltennamen. Die erste Spalte enthält die Zeitwerte und der Rest der Daten sind Gleitkommazahlen (float, real). Hierbei ist zu beachten dass die Werte Zellen der Excel Datei nur aus Zahlen bestehen. Ansonsten werden sie als String interpretiert und können nicht eingelesen werden. Ebenfalls zu beachten ist das Datumsformat der Zeitspalte, dieses sollte nach Excel Format “Custom: TT/MM/JJJJ hh:mm” formatiert sein.

Data Import
Attention
Only measuring points that do not have a connector connection are available
An import configuration is created for each column entry in the imported Excel file. The configuration consists of the following points:
Blue area: Name of the column from the importing Excel file
Red area: Data type to which the imported value is to be written, e.g. meter reading, is written to the meter reading of a meter measuring point
Green area: Measuring point to which the values are written (the available measuring points are determined by the type selection)
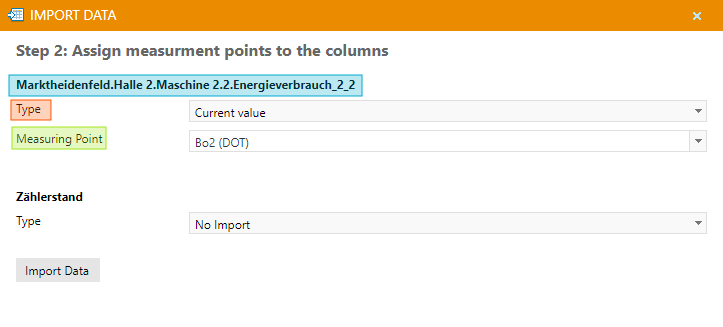
Description of the import types:
No import: This column is ignored during import
Actual value: Is written to the value of an actual value
Text: Writes the imported value as a string to an actual/setpoint value
Setpoint: Writes to the value of a setpoint
Meter values (power): Writes the value to the working value of a meter (meter reading is not included in the calculation)
Meter values (work): Aggregates the value to one hour and writes it to the work value of a meter (meter reading is not included in the calculation)
Counter reading: Writes the value to the counter reading of a counter (the work of the counter is automatically calculated here)
Attention
Existing values for meters are not overwritten by the import. If you want to update meter values through the import, you must first delete the previously existing values and can then import the new values.
Export measurement points
The measuring points can be exported via the measuring point grid in order to import them again, e.g. in another branch or installation. For this purpose, additional (system) attributes of the measuring points are exported in addition to the values displayed in the grid.
This function is also used to create a larger number of measuring points via Excel.

Import measurement point definitions
The exported measuring points can be re-imported, e.g. in another branch or installation.
Attention
The connector must already exist and is not created by the import!
The modified Excel file can then look like this, for example:

It is not necessary to specify an ID, as it is automatically assigned by the system. During import, error messages may be displayed if inadmissible configurations have been made!
Timeseries App
This evaluation allows the display of values from several measuring points in a table. The special feature here is that the measured values of all measuring points are included in a higher-level time series.
If no values are available for a measuring point at a certain point in time, the corresponding cell remains empty.
Table operations
Sorting
Sorting in ascending and descending order is possible by clicking on the column heading or via the column menu.
Filtering
Filtering is possible via the column menu. If multiple filters are applied, they are coupled with an AND link, which means that all filter conditions must be met for a record to be displayed.
Move columns
The columns can be dragged and dropped and rearranged.
Show or hide columns
Columns can be shown and hidden via the column menu. For this purpose, the checkboxes in front of the columns are set accordingly and the selection is confirmed.
Time references
In edit mode, a time reference can be set for each measuring point. Setting a time reference means that only values are displayed for this measuring point at the time of which the reference value also has values.
Thus, it is possible, for example, to display automatically logged values that are recorded every minute only at those times when a manual input was made, which, for example, only takes place hourly. The table is not overloaded with unnecessary entries and remains clear.
The referencing logic can be switched between second and minute. To do this, the setting in Edit mode in the left menu must be changed accordingly.
ResMa does not capture values below the second level, so referencing at the second level represents virtually all available data.
At the minute level, on the other hand, there can be multiple records. In this case, only the oldest data record is selected, i.e. at the beginning of the minute. The remaining records are discarded and not displayed.
Manual inputs
This APP makes it possible to add input values to data points that are not automatically logged. In combination with the time referencing function, the APP allows, for example, event-based or cyclically automatically created data records to be added manually.
For this purpose, automatically logged measuring points and manual input points are added to the APP and the time referencing is configured according to the requirements.
The edit function can then be activated for the input measuring points of a row by clicking the Edit button.
The line’s input points are then displayed as input fields to signal the variable range. Now values can be added or changed. Tabs can be used to switch between the input fields of a line. After the last input field, the Refresh button is highlighted, which can then be pressed by pressing Enter. Alternatively, you can click or tap mobile.
Automatically logged values cannot be changed in the same way as the other manual input interfaces.
All entries via this APP are recorded in the input protocol and are therefore traceable.
Coloring of manual inputs
A minimum and maximum can be defined in the master data of a measuring point. If a value is entered outside these limits, the corresponding input field is colored red. It is not possible to save the values.
If an unusual value is entered, the input field is colored orange. When saving, the user is informed about this and must actively confirm the saving process again.
The parameters for limits and common values are loaded at specific times:
When adding a measurement point for exactly this measuring point
When loading an existing profile
Configure Dropdowns
A drop-down can be defined for the manual input of strings, so that only certain predefined values are available for selection. This makes it easier to evaluate entries.
For this purpose, the drop-down switch can be activated in edit mode in the left menu at a string input measuring point. The selection options can then be defined in an input field. The order of the selection options in the drop-down depends on the order in which the selection options are configured.
Fill text values
String measuring points often contain information about orders or batches that are only written when the value changes and are therefore not available in every line in the tabular overview of this APP.
However, the user who wants to make manual inputs needs this information as reassurance to ensure that the manual input is in the correct line (to the correct order, …).
For this purpose, the Fill Text Values switch can be activated in edit mode in the left menu at a string input measuring point. Values are then displayed in each row in the APP for this measuring point. The filled values are displayed in gray, the actually existing values in black. The premise applies: A value is valid until it is replaced by a successor value.
Documents & WebApplications
Any web page can be integrated into ResMa® via an iFrame. The prerequisites for this are that the URL is accessible in the existing network and that the target source allows embedding.
The iFrame is called up via the entry “iFrame” in the menue:
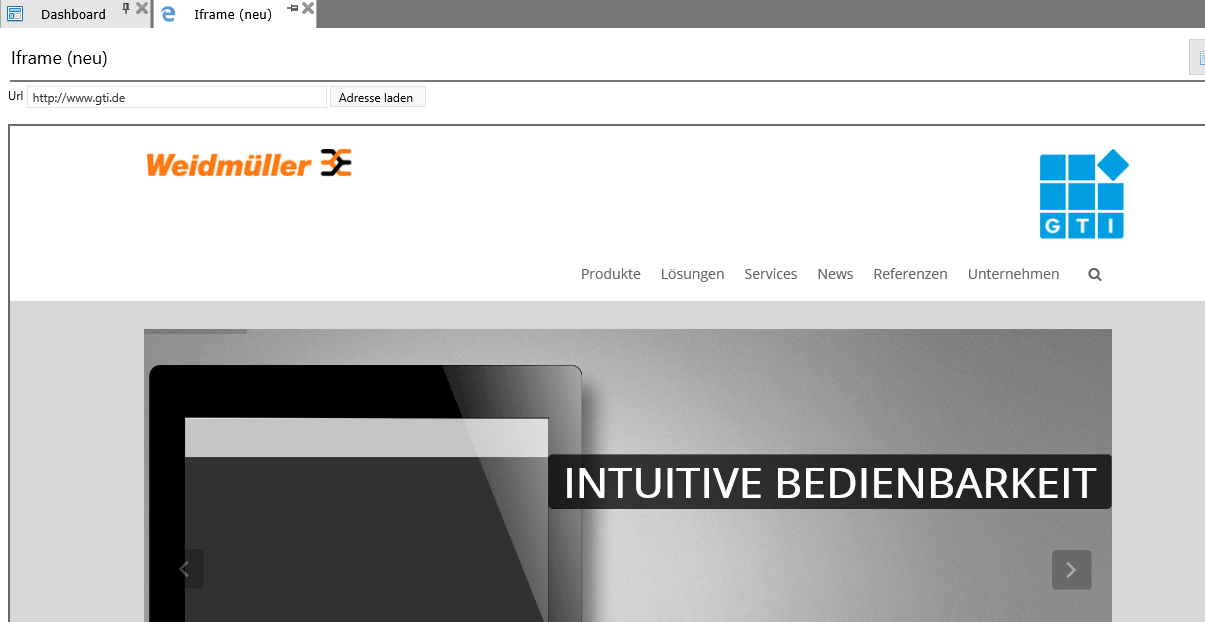
Since ResMa 3.7.0 there is the possibility, to display pages unencrypted via an https environment. To do so, you have to activate the Checkbox “Proxy-Functions” that the http-pages can be loaded. We suggest to load all pages via https.
Disturbances
Alert history
In the menu under Alerts, all alerts triggered by ResMa® are displayed in an overall overview.
Alerts and Alert history are displayed separately. Alerts show active alerts which means that the disorder still exists.
Meaning of symbols
|
This icon indicates that the alert is still active and has not yet been reset. |
|---|---|
|
If this symbol appears, the alert has already been reset by the controller or a user. |
|
This symbol indicates that the alert has already been acknowledged. |
|
If this icon is displayed, a alert forwarding has been created for this alert but has not yet been forwarded. |
|
This icon indicates that the alert has been forwarded. |
Alert details
Via the info symbol at the end of each line, further details about the respective alert can be viewed.
Reset alerts
Most alerts reset automatically. However, it is possible to reset the alert manually via the corresponding button, either in the alert grid or in the detail view.
Acknowledge alerts
However, there may also be malfunctions that must always be handled by the ResMa® operator. Therefore, alert definitions can be marked as requiring acknowledgement. If this is the case, any alert message must be acknowledged via the acknowledgement button.
When you press the button, a new window appears in which you can enter an acknowledgement comment and confirm the acknowledgement. The acknowledgement procedure ensures that every alert is processed and that no duplicate processing of the alert message takes place.

Alert Definitions
In the “Alert Definitions” view (“System” > “Alert Definitions”), all alerts are listed with the corresponding alert numbers and the corresponding messages. Here, texts of alerts can be changed or alerts can be marked as requiring acknowledgement.
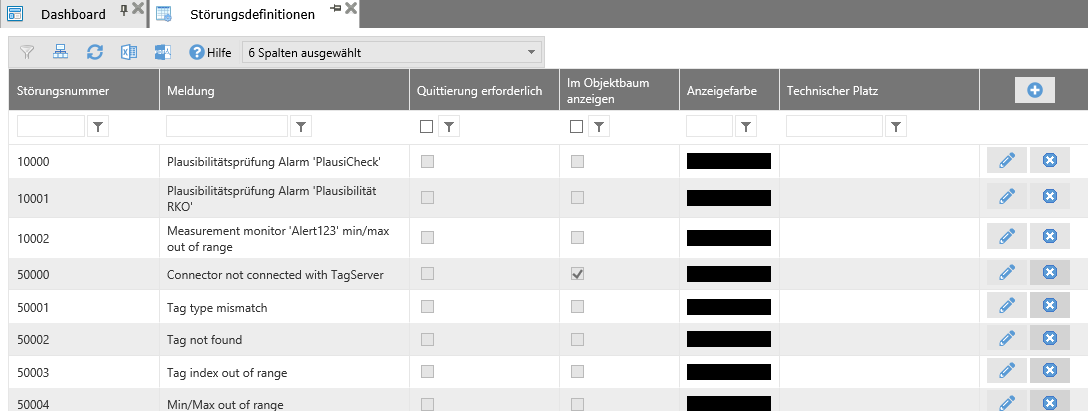
In addition, there are already predefined alerts by the system. The disturbances in the area 50xxx are disturbances that are triggered by the connector.
Alerts with an alert number in the area 60xxx are system alerts triggered by the ResMa® system.
In addition to alert number, message text, description, color, it is also possible to define whether the alert should be displayed in the object tree.
In addition, there is the possibility to define an alert forwarding by e-mail.
Alert forwarding
In this display, all alerts already sent via alert forwarding are displayed and can be filtered.
Alert logic
As soon as data is transferred from the connector to ResMa, the values are checked one after the other:
Is there a measurement point monitor for the value?
Is the measuring point parameter of a derived value for which a measuring point monitor is available?
Value check
Value OK:
If an alert exists, it is deactivated and the end time will be set
Value not ok:
Check whether an active alert with the alert number already exists
Yes: Check Settings for alert recycling
During recycling, the number of alerts is counted up
If the recycling has expired, a new alert is generated
If no, a new alert is generated
When creating new alerts, mails can be sent if
Forwarding is active,
Contact person with forwarding is configured in the alert,
Mail configuration is set up.
 Branch Edit Mode
 Consumer Edit Mode
 Measuring point edit mode
 Connector Edit Mode
 Connection edit mode
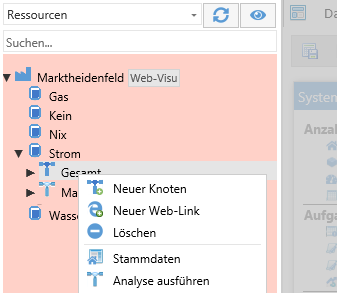 Resource Editing Mode
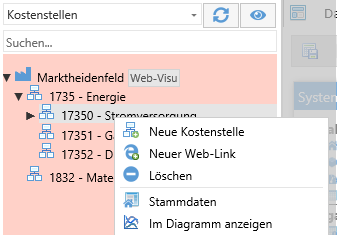 Cost Centers Edit Mode


