Reporting
ResMa® offers a set of functions for evaluations:
Reports (self-created reports and externally added system reports)
Charts
Pie charts
Pivots
State Statistics
Data export
Documentations
Reports
The report is one of the most important and powerful elements of data analysis. With the help of the Online Report Designer you can compile your own reports. A report consists of one or more pages. Controls can be added to the pages, such as .B table, image, text box, chart, or pie chart.
The report is called up via the entry “Report” in the menu:
Any values can be transferred from the object tree to the report via drag & drop.
Report Configuration
Time ranges
As soon as data from a measuring point is to appear in a report, a time range must be selected. If you change the time range, all associated data is automatically reloaded. You can add more time ranges by clicking the plus button. However, all other time ranges refer to the first time domain. So when you change the first time range, all other time ranges automatically adjust. If this is not desired, individual time ranges can also be defined as “Fix”.
Data sources
In order to be able to display data from a measuring point in the report, they must first be assigned to the report. To do this, drag and drop a measuring point from the object tree into the Report Designer.
Configuration table
The table automatically exists as a control in a new report. However, additional tables as well as rows and columns can also be added.
To edit a cell or table, click in a cell in the table. Subsequently, the surface will change slightly.
On the one hand, a ribbon appears above the cell via which you can change the appearance of the table.

A window appears on the left side where you can set the contents of the cell. Depending on which data the cell is to display, further configuration options are added.
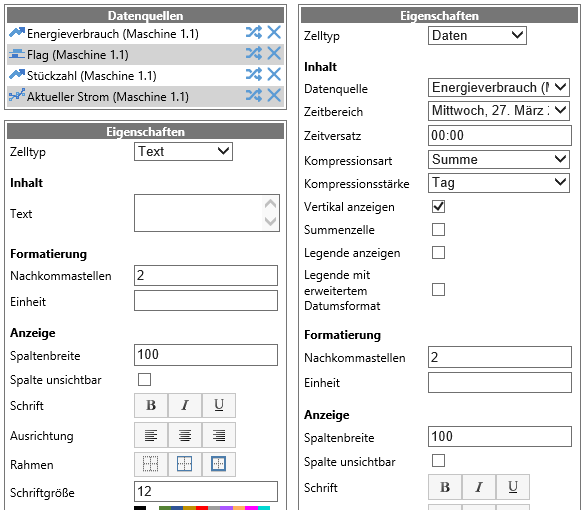
Compression options
The following compression options are available.

Time series display
With ResMa 3.8, a time series display was implemented in the report grid. This means that the values are displayed uncompressed, as they exist in the database. The new “Time Series” cell type is available for this purpose.
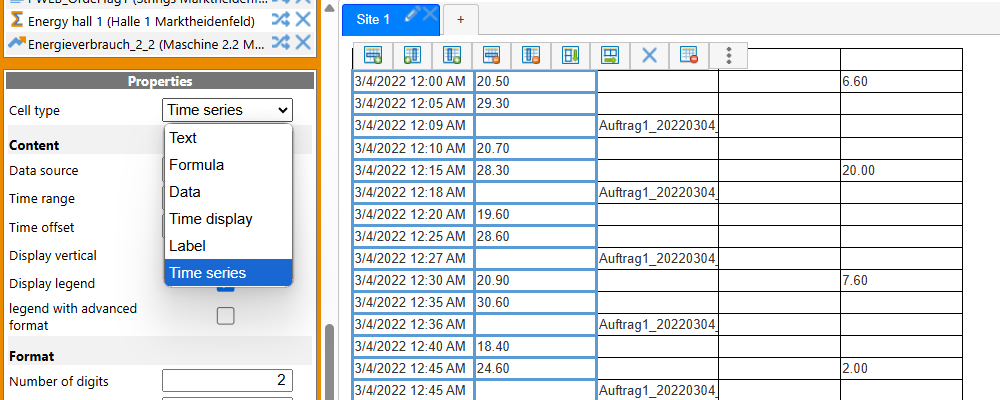
The first cell of the “time series” type determines the time range, a possible offset and the display of a legend.
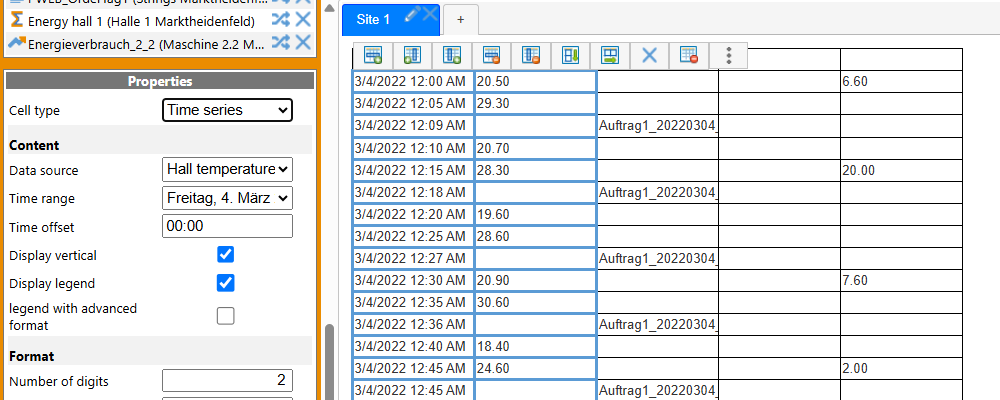
All other cells in this grid use these parameters of the first cell, so only the measurement point can be specified for these.
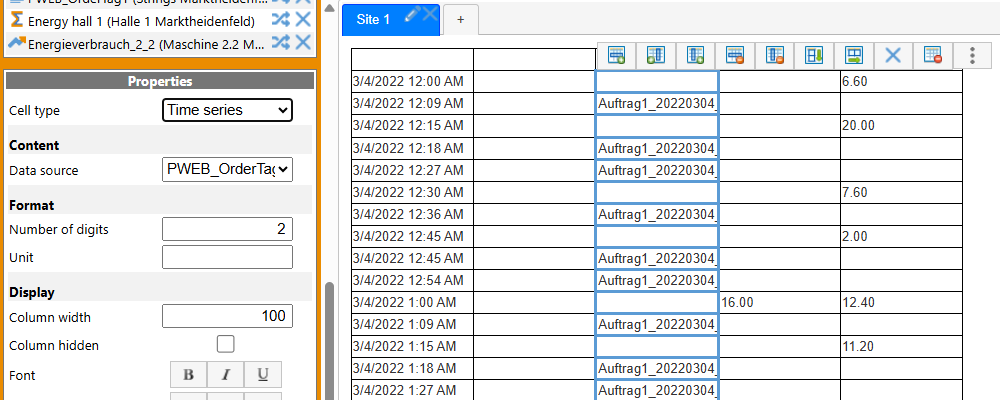
The result is a table in which the values are displayed uncompressed, just as they are in the database.
Configuration Image
Via “New Image” one or more arbitrary images can be integrated into the report. For this purpose, the image is loaded into the report via the upload dialog.
Configuration text field
The text field can be used to create e.g. headings in the report. There are various configuration options for displaying them.
Configuration Diagram
In principle, there are two ways to create a chart in the report. The simplest is to load a predefined profile of a chart. However, you can also define an independent diagram in the report.
Configuration Piechart
An existing profile of a piechart (pie chart) can also be integrated into the report.
Configuration Heatmap
An existing profile of a heat map can also be integrated into the report.
Configuration input field
An input field is intended to make non-persistent entries in the report without having to or being able to edit the report. the configuration is the same as the text box.
Order Reference Configuration
Already when configuring a measuring point in the table, you can define an order reference. However, this is rigid, and can only be changed in edit mode.
Now a drop-down box can be created via which the order reference can be changed for display. Furthermore, further measuring points can be defined for which the order reference should also apply.
Configuration Manual Input
A button can be placed on the report to directly open an existing manual input configuration (profile). The profile must be selected as a parameter here. Optionally, the appearance of the label of the button can be changed.
Operation Report
The general operation of the report is carried out via the header bar. This is different for edit and view modes.

These include:
Save current view as profile: The current view is saved as a profile with all settings (-> see also Profiles)
Reset current view: The report reverts to an empty dealert view
Updating: The report is updated, any values received in the meantime are also displayed
Export as an Excel file: The values of the report are exported to an Excel file
Save as PDF file: The report is exported as PDF
Automatic shipping: Configuration of automatic shipping (-> see automatic export)
Help: Online chart help
Editing: Switching between Edit and View modes
Export report to file or import report from file: Ability to export and import reports
Cut Control: Cut Selected Control
Copy control: Copying the selected control
Insert controls: Setting controls in the current location
Copy format: Copying the format of the current control
Undo: Undoing the previous action
Restore: Recover backed action
Note
In order to be able to further edit a newly saved profile, the report should be closed after saving and the new profile should be called. Otherwise, ResMa® assumes that another new profile will be saved.
System Reports
In this view, you can add new, additional Telerik reports to ResMa®. When creating, you must first specify a name. Optionally, you can specify a description, which is then displayed as a tooltip. Then select the Telerik Report file to upload it. Use the “Customize database connection” check box to define whether the database connection of the report is to be replaced by that of the ResMa® system. Then select the user groups that you want to have access to the report.
Knowledge of the Report Designer can be learned directly via Telerik. The database structure of ResMa® can be taught as part of a training course for software developers. For this purpose, basic SQL knowledge is a prerequisite.
If a parameter “CurrentUserId” is in a report existing, the UserID of the user that is logged on will be written to the parameter. The parameter “StartTime” and “EndTime” will be set invisible and replaced by an time-range-element.
Hints for creating a report:
If there is a parameter “CurrentUserId” in the report, the Parameters described with the UserId of the logged-in user.Exist in a report parameters named “StartTime” and “EndTime”, they are automatically switched invisible and replaced by replaces a time range selection element.
Standard Report Monthly Evaluation (Order Reference)
The report consists of a ready-made template and serves as a monthly report for any measuring points. It can be used with or without order reference.
Import Report
First, the Telerik report must be imported into ResMa® via the interface. The entry point for this has been moved from “System” to “Reports”.
A meaningful name and a description of the report must be provided here. Likewise, whether the database connection should be adjusted, which is recommended for a report that is to access the ResMa® data.
In addition to the import of the actual report file, it is also necessary to specify which user groups should have access to the report.
Creating a Report Profile
In the menu under “Reports” the item “Report Parameters” must be opened
Click on the “+” in the table at the top right and an editor opens to create a new report.
A descriptive name and description of the report configuration must be specified here. The name appears later on the report.
Here you can also choose whether the report is to be used with or without order reference.
Add measurement points
First, expand the sub-table of the report configuration, and then click on the “+” here as well.
A new dialog opens for creating a new report parameter.
Here you have to select the desired measuring point via the combo box.
The order of the elements can be changed in the sub table by Drag’N’Drop.
View Report
Now you can open the previously imported report via the report menu, select the corresponding profile and the desired period. Clicking on “Preview” generates the report.
Diagramm
The chart is one of the most important functions of data analysis. Any values can be dragged and dropped from the object tree into the diagram and displayed differently (color, shape, line thickness, etc.).
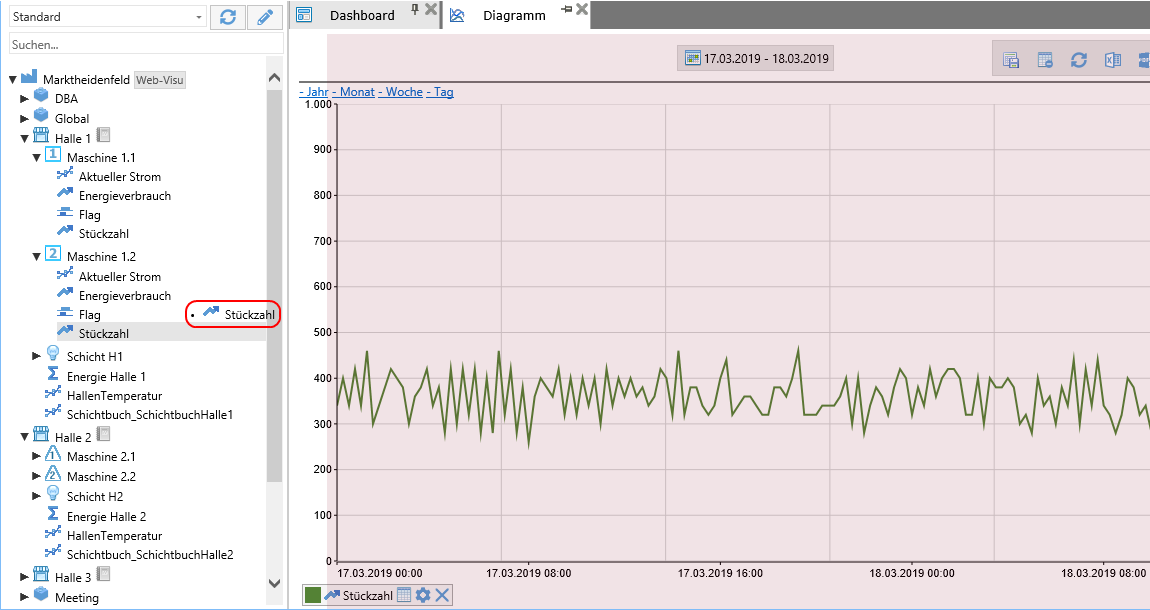
Multiple values can also be displayed in a chart.
Operation Diagram
General settings for a diagram are made via the header bar.

These include:
Save current view as profile: The current view is saved as a profile with all settings (-> see also Profiles)
Reset current view: The chart reverts to a blank dealert view
Update: The diagram is updated, any values received in the meantime are displayed
Export as an Excel file: The values of the chart are exported to an Excel file
Save as PDF file: The diagram is exported as PDF
Automatic shipping: Configuration of automatic shipping (-> see automatic export)
Help: Online chart help
Go to Change Chart Evaluation Period
Adjust chart: This allows you to make different settings for the axes and compare data
Create a value comment: Create a comment in the chart for a selected area for documentation
Show / show value comment Show or show the value comment for better clarity
Save current view as documentation Saves the current view as documentation for later use
Request current data Requires up-to-date data through the connector
Comparison of time ranges
With “Adjust Chart” you can define a comparison of time ranges to compare the data of a curve e.g. with that of the previous week.
Curve settings
For each measured value that is displayed in the chart, a color legend appears at the bottom of the chart window. The color of the curve and the name of the measured value are displayed here. In addition, you can display the “history of the value” in a table, as well as change the “curve settings”.
In addition to the color, you can also change the representation of the curve (line, area, steps, bars…), the compression type (sum, average…) and the compression strength (none, hour, day…).
Last but not least, the curve can be removed from the diagram with the “X”.
Pie chart
The pie chart is another evaluation function in ResMa®, which has been added in version 3.0. The pie chart is called up via the entry “Piechart” in the menu:
Using the pie chart, several numerical values can be compared relatively with each other.
Operation Pie Chart
General settings for a pie chart are made via the header bar.

These include:
Save current view as profile: The current view is saved as a profile with all settings (-> see also Profiles)
Reset current view The pie chart reverts to a blank dealert view
Update The pie chart is updated, any values received in the meantime are also displayed
Export to a PDF The pie chart is exported as a PDF
Editing: Switching between Edit and View modes
Pie Chart Settings
For each measured value that is displayed in the pie chart, the color can be subsequently set in Edit mode.
Last but not least, the curve can be removed from the pie chart with the “X”.
Pivot
Another important and powerful evaluation function in ResMa® is the pivot. The pivot table can be used to create complex queries of the values. Ranges and time periods can be listed as crosstabs.
Any values can be transferred from the object tree to the report via drag & drop.
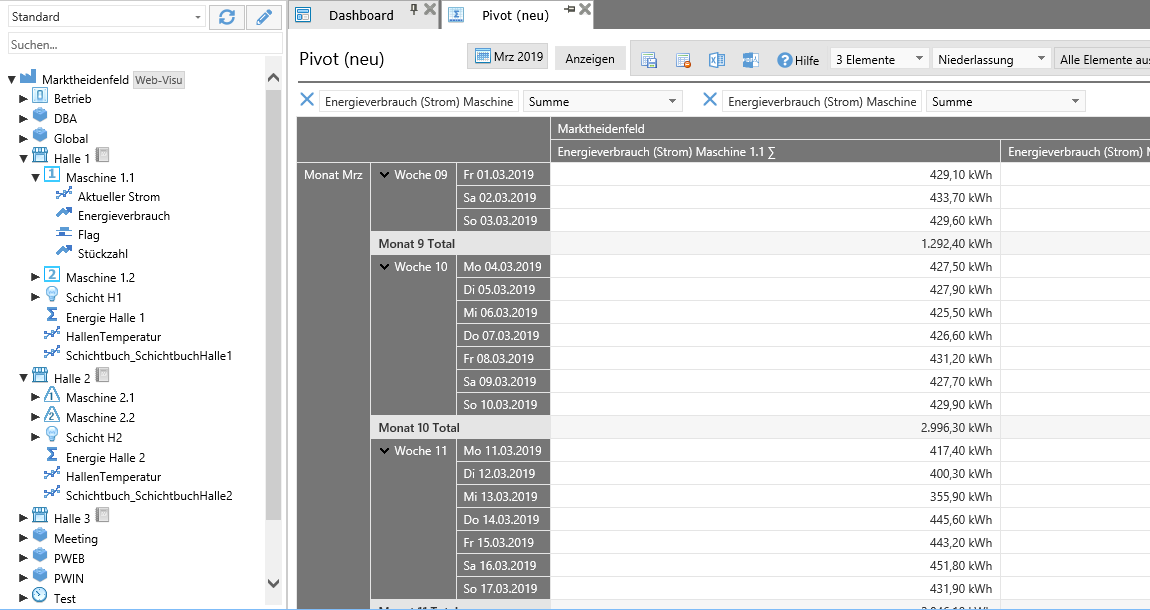
Settings and operation Pivot
General settings and the operation of the pivot are made via the control bar and header.

These include:
Enable/Disable Auto-Refresh: Deactivation of automatic calculation after a measurement point is added. The calculation must be triggered manually via the refresh button.
Save current view as profile: The current view is saved as a profile with all settings (-> see also Profiles)
Reset current view: The pivot reverts to an empty dealert view
Export as an Excel file: The values of the pivot are exported to an Excel file
Save as PDF File: The Pivot is exported as PDF
Automatic shipping: Configuration of automatic shipping (-> see automatic export)
Help: Online Pivot Help
Temporal grouping: Selection of temporal grouping
Grouping of measuring points: Selection of the grouping of measuring points
Branch: Selection of the branch
Show Line Total: Show/Hide Row Sum
Swap column / row header: Swapping the column and row header
Column / rows: Display measuring point name as column or row heading
Show unit: Show / Show the unit
Show original name: Show original name of measuring points
Assignment of legend: Show / show the legend with the measuring points
Measuring point settings
Each measurement point displayed in the pivot appears at the top of the legend. Settings for the aggregation of the values can be set here.
Last but not least, the measuring point can be removed from the pivot with the “X”.
Analysing the state
Logical measuring points can be analyzed very easily with the status evaluation. The analysis provides information about the frequency of activation, average duration, minimum duration, maximum duration and total duration of the active state.
Measuring points can be added to the analysis via drag & drop from the object tree.
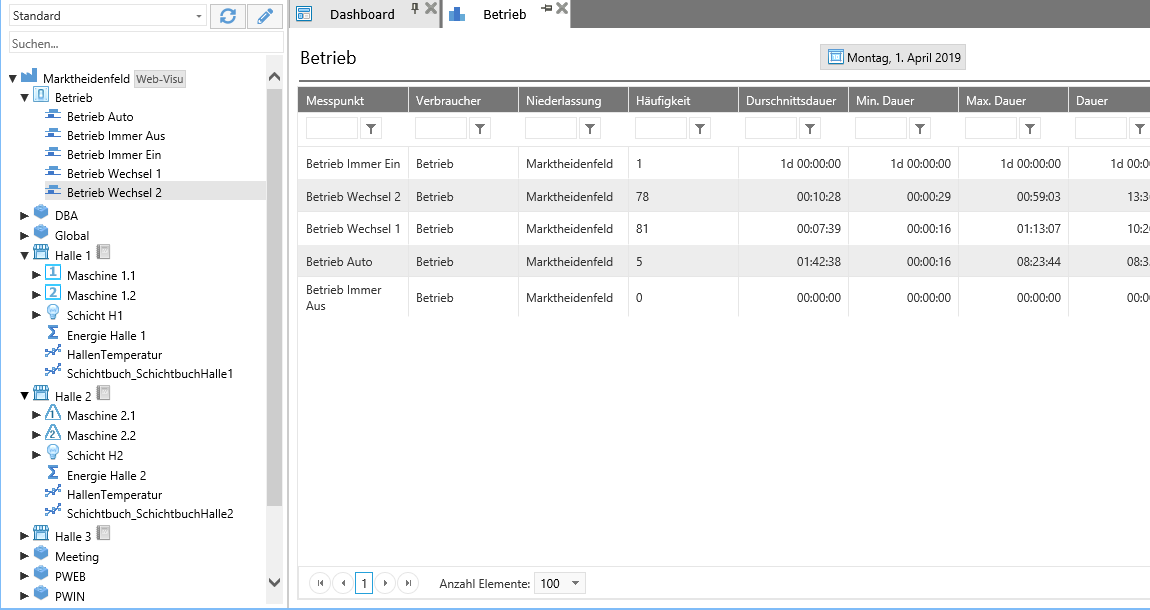
In addition, one measuring point can be defined as a reference, the other measuring points are then evaluated relative to their duration. This reference affects the percentage display.
Combine related areas
Logical measuring points are often recorded when the value changes. By default, the analysis therefore evaluates each data set of a rising edge individually.
If, on the other hand, the measured values are recorded cyclically according to a fixed time interval, there may be several data sets in a series, which represent a rising or falling edge and are thus recorded individually to calculate the frequency, for example.
However, if the evaluation is only to consider value changes, the Combine related areas function must be activated in the page tools. Thus, even with cyclical recording, a change-oriented analysis can take place.
In principle, the values of logical measuring points should be recorded on a change-based basis. A later change-based analysis of cyclically recorded values is possible, but computationally intensive.
Data export
Via the data export it is possible to export a larger amount of data in order to be able to process it further in an external system.
The advantage here compared to the value grids is that the data is not sent completely to the front end (browser) for display, but only a preview with the first and last data in the selected area. In addition, several data points can be exported at once.
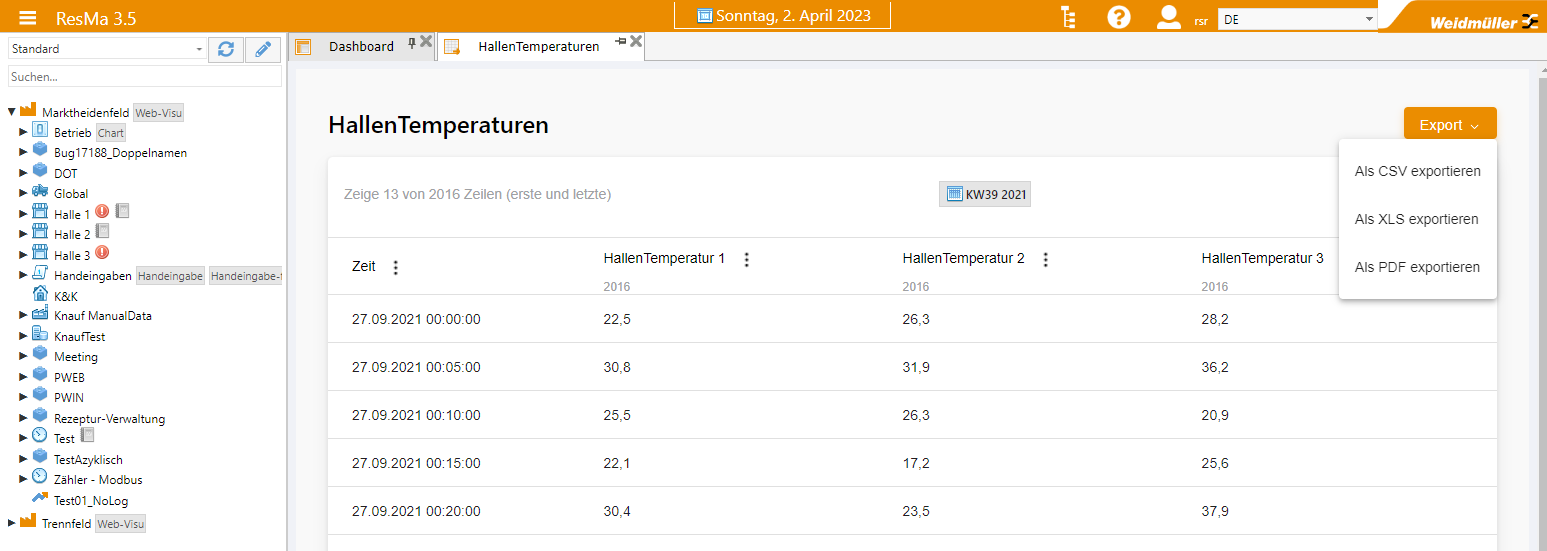
CSV, XLS and PDF are available as export formats.
Data Import
The Import module makes it possible to:
browse external data sources,
Map time series data to measuring points,
Configure import jobs,
Automatically execute import jobs cyclically and thus
automate the transfer of time series data from third-party systems.
Configure import
An import must be configured. The data source, data to be transferred and measuring points involved as well as an interval for cyclic execution are determined.
Create an import
Entry point
Click path: Menu > Data Import
It opens the import overview page. This page is the central point of administration for your imports. All existing imports are displayed and new imports can be added here.
To add a new import, click the + New Import button on this page. The configuration dialog opens.
Select data source
In the first step, select the type of data source from the drop-down. Then click on the Next button.
Currently, the import only supports Microsoft SQL Server as a data source. In principle, it is possible to extend the possible data sources to other databases, file formats (.csv, .xml, .json) and certain web APIs.
Connect to the data source
In the second configuration step, you connect to the data source and test it. For a Microsoft SQL Server, enter the connection data in the appropriate fields:
Server (IP or server name)”
Port
User
Password
Make sure that the data source can be reached over the network from your ResMa system. The user must have appropriate rights on the database server in order to be allowed to request the desired database and its data.
Once configured, the connection can be tested. To do this, click on the Test Connection button. The system now tries to establish a connection based on the entered connection data. A notification informs about the result of the check.
Proceed to the next step:
A change to the third configuration step is only possible when a working connection has been created, as the connection is automatically checked when you click Next. Unfortunately, further configuration is not possible without a successful connection.
Selection of data
In the third configuration step, you navigate to the desired table via the source database and then create a mapping between the time series data of the source and ResMa.
Database
In the Database drop-down, select the database you want to use as an import source.
Table
Next, in the table drop-down, select the table in which the data to be imported is located.
After selecting a database table, a preview of the data is displayed. Dropdowns can also be found above each column.
Map measuring points
The dropdowns can be used to map the import data to ResMa measurement points. To do this, select the measuring point to which you want to import the data of the corresponding column in the corresponding dropdown.
For columns that you don’t want to import, leave the selection blank.
In the dropdowns for the measurement point mapping, the measurement point selection is restricted. You can choose from measuring points that
can accommodate the data type of the column, and
have not stored a connector connection in their master data dialog.
Timestamp
A column must be marked as a timestamp. The values of the columns mapped to measurement points can thus be written to this timestamp.
Source data format
If the data is not available in a suitable form, it may still need to be transformed. This can also be done in the form of a database view, since views can also be used as data sources in addition to tables.
Proceed to the next step:
Once the mapping is complete, click on the Next button. The button is activated as soon as a mapping exists for
the timestamp, and
at least one measuring point.
Determine the execution interval
In the fourth configuration step, you assign a name and configure the execution time and request period of the data.
Name
By default, the name is [Database]. [Table]. You can replace this value with a catchy name. The name will be displayed later in the import overview.
Execution time
Here you can select in which cycle and at what time the import should be executed.
First, select the Execute time. This ranges from one-time to monthly. The selection influences the further choices. Not all options are available for all repetition rates.
Then, if necessary, select additional details such as execution days and time.
Request period
The request period determines the time interval of the source data to be imported. The selection element depends on the selection of the execution time.
If a one-time import was selected in the execution time, a fixed time interval of … until… can be entered.
For all other execution times, a relative selection is possible. In combination with the execution time, it is e.g. It is possible to configure an import that imports all data from the last 2 days once a day. This involves overwriting data on existing timestamps and inserting new data.
Completion of the configuration
Before closing the dialog, you can navigate through the configuration steps again by clicking on the respective numbers in the dialog header. In this way, the configuration can be checked again.
If you are satisfied with the configuration, click on the Create import button.
A notification informs you whether the import could be created successfully. The entry can also be seen in the import overview.
In the future, the import job will be carried out automatically according to the configuration.
Import overview
The import overview serves as a central entry point for managing imports.
Click path: Menu > Data Import
The overview shows a list of existing imports as well as some details on how to configure them. At the end of each list entry is the three-dot menu. Click here to access more features.
Start import
The start Import function executes the import immediately, regardless of its configured execution time.
Edit
The Edit function opens the configuration dialog. It is not possible to change the data source (step 1) and the connection (step 2) at a later date. Data selection (step 3) and interval configuration (step 4) are possible at any time. Navigation is done by clicking on the steps in the dialog header.
To save changes, navigate to the last step and click the Update Import button.
Delete
The Delete function makes it possible to remove imports from the system that are no longer needed. The deletion is final and cannot be undone.
Import procedure
Importing values is very different from collecting data through connectors. When importing, huge amounts of data can be transferred in a very short time, so some features of ResMa are not applied here. This increases the performance of the import and, if necessary, protects users from a flood of alarm mails.
The following functions do not apply when time series data is received via the import:
Alarm,
Shiftbook functionality,
Validity check,
automatic order entry.
Documentation
Documentation of events
With the help of the documentation, abnormalities can be documented and managed. In the menu under “Administration” => “Documentation” a complete overview of all documentation is displayed.

In the diagrams, special events can be documented with a link to the respective curve in order to go directly to the saved view in ResMa®.
In the area of branches, documentation can be used to exchange information and tasks between employees.
Documents in master data
Since ResMa® 3.0 it is possible to manage documents for branches, consumers, connections and measuring points.
This makes it possible to save data sheets or manuals for counters in ResMa® in order to always have them at hand.
To save a document, the master data of the corresponding object is called up in the tree.
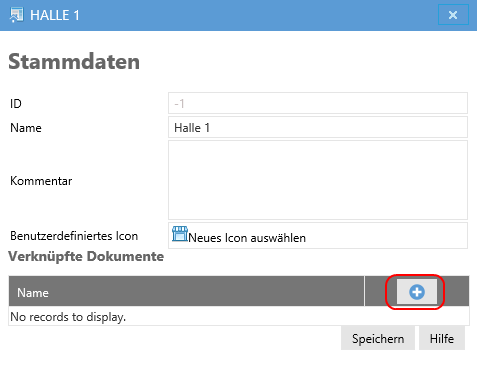
The plus symbol will open a dialog that can be used to upload the associated document to the server.
Carbon Footprint
In ResMa, it is possible to determine the emission quantities of various greenhouse gases using meters. The resources, greenhouse gases, and validity start point are stored here. Based on the validity start points and their conversion factors, the emissions can be measured in kilograms for the meter readings during this period.
Prerequisites for the calculation are:
A meter-type measurement point with values
A resource with greenhouse gas and validity start point
Measuring point and resource are in relation
Greenhouse gas emissions can then be viewed under the “CO2 Report” app or, if there is an order link, also under “Orders”.
For the order-related view, you also need:
A measurement point with order reference
To display the CO2 emissions in the respective order, you have to open the order statistics of the desired order in the “Orders” app. Here, the CO2 emissions are displayed in the last column.
Below the table is an additional list of greenhouse gases and their totals.
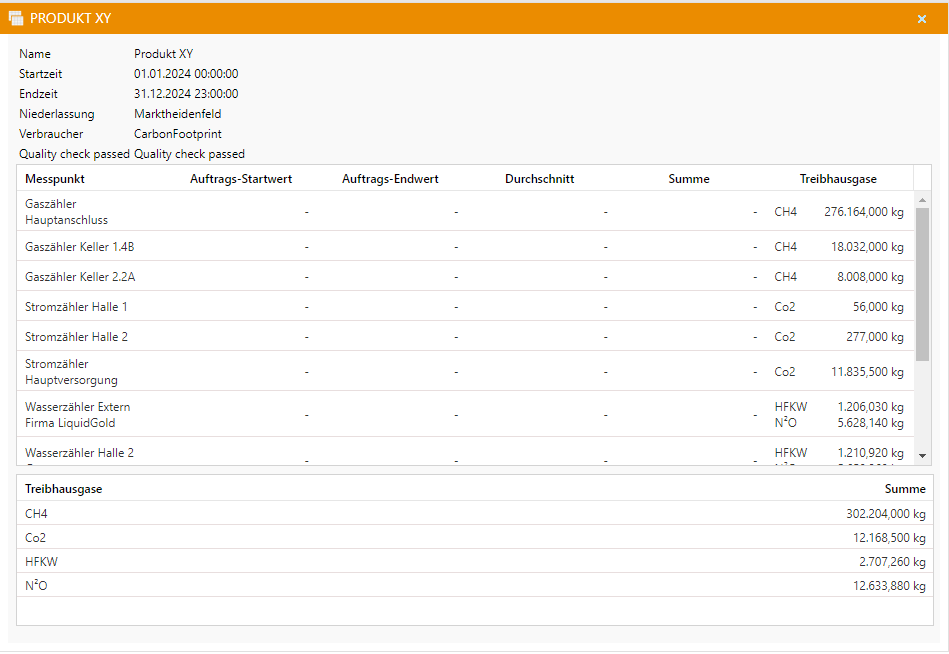
CO2 Report
The CO2 Report is a detailed overview of the total emissions of greenhouse gases over a certain period of time. Furthermore, it subdivides the different greenhouse gases, counters and their scopes. You can export the report to different formats via the top menu bar.
At the beginning you have to select a period of time via the DateTime Picker for which you want to view the data. Then select the desired branch and confirm your details with the “Preview” button.
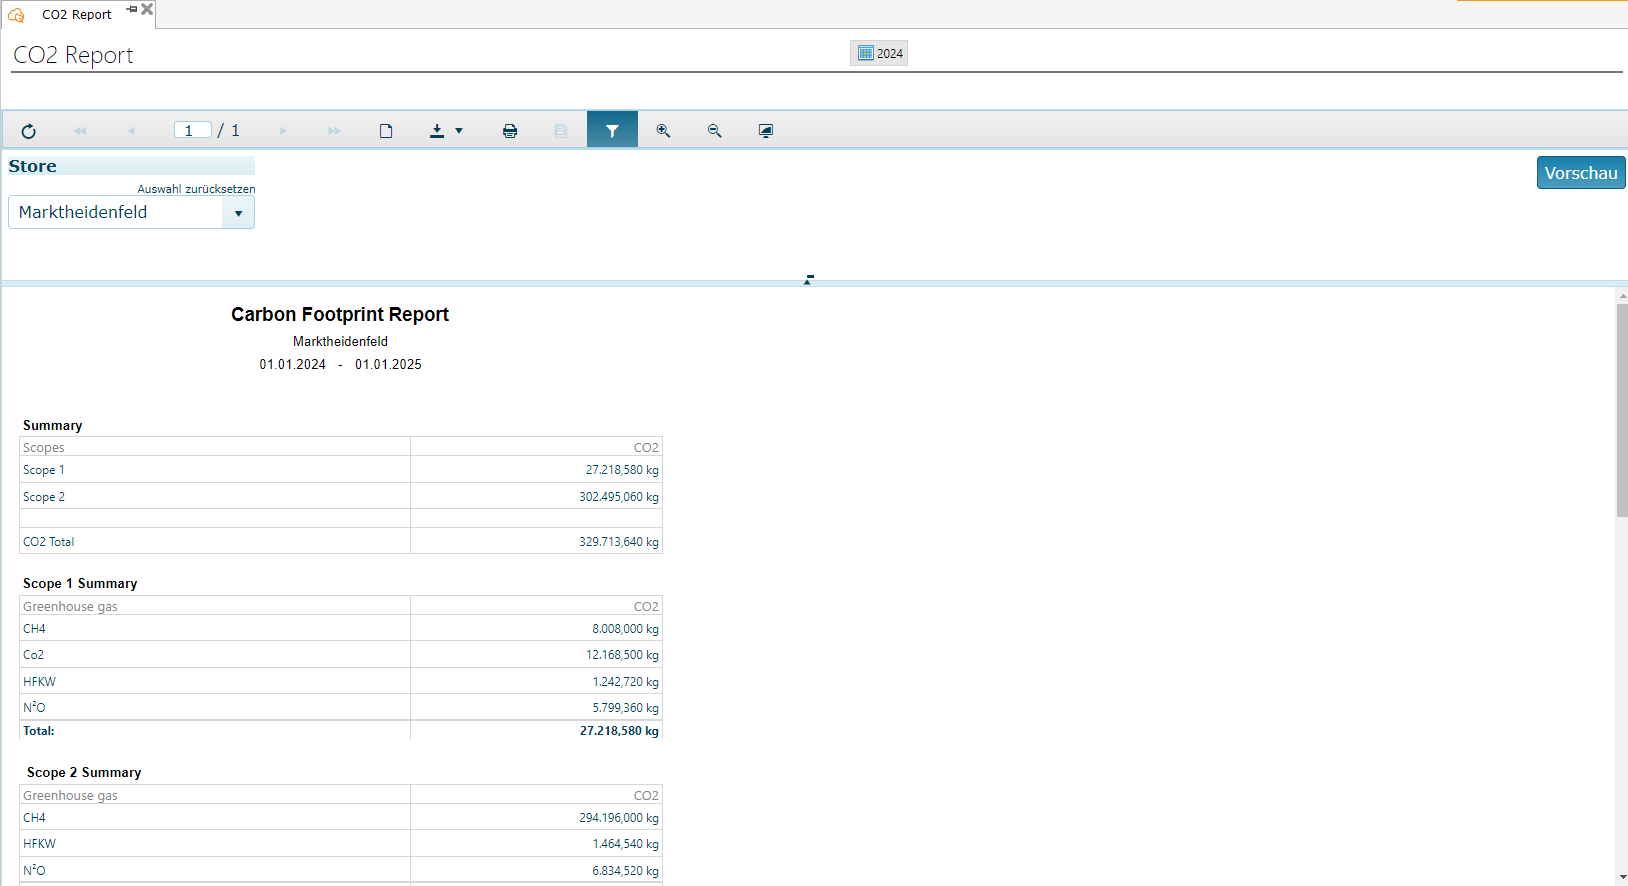
The structure of the report:
Overview (Here the greenhouse gas emissions are divided into the respective scopes and listed once in total)
List of the individual scopes and their greenhouse gases (here the totals of the greenhouse gases in their respective scopes are shown)
Detailed scope overview (shows the corresponding counters for the greenhouse gases, with their individual values and summation)
The two relevant scope variants are:
Scope 1 These emissions are generated or controlled by the company.
These include, for example, emissions from the combustion of fuels in company-owned vehicles, boilers, furnaces and other equipment, as well as emissions from industrial processes and chemical reactions.
Scope 2 are indirect greenhouse gas emissions that come from the production of purchased energy.
This includes emissions from the production of electricity, steam, heat or cooling that are purchased from an external provider.