User Interface
Start page with user login
ResMa® always starts with user authentication to ensure that only authorized users can access the system. Users can be configured individually and are assigned specific permissions for available functions and permitted data access.
Access to the user interface is provided through a browser using the URL of the ResMa® server. The IP address or server name is defined by the administrator during installation.
User interface
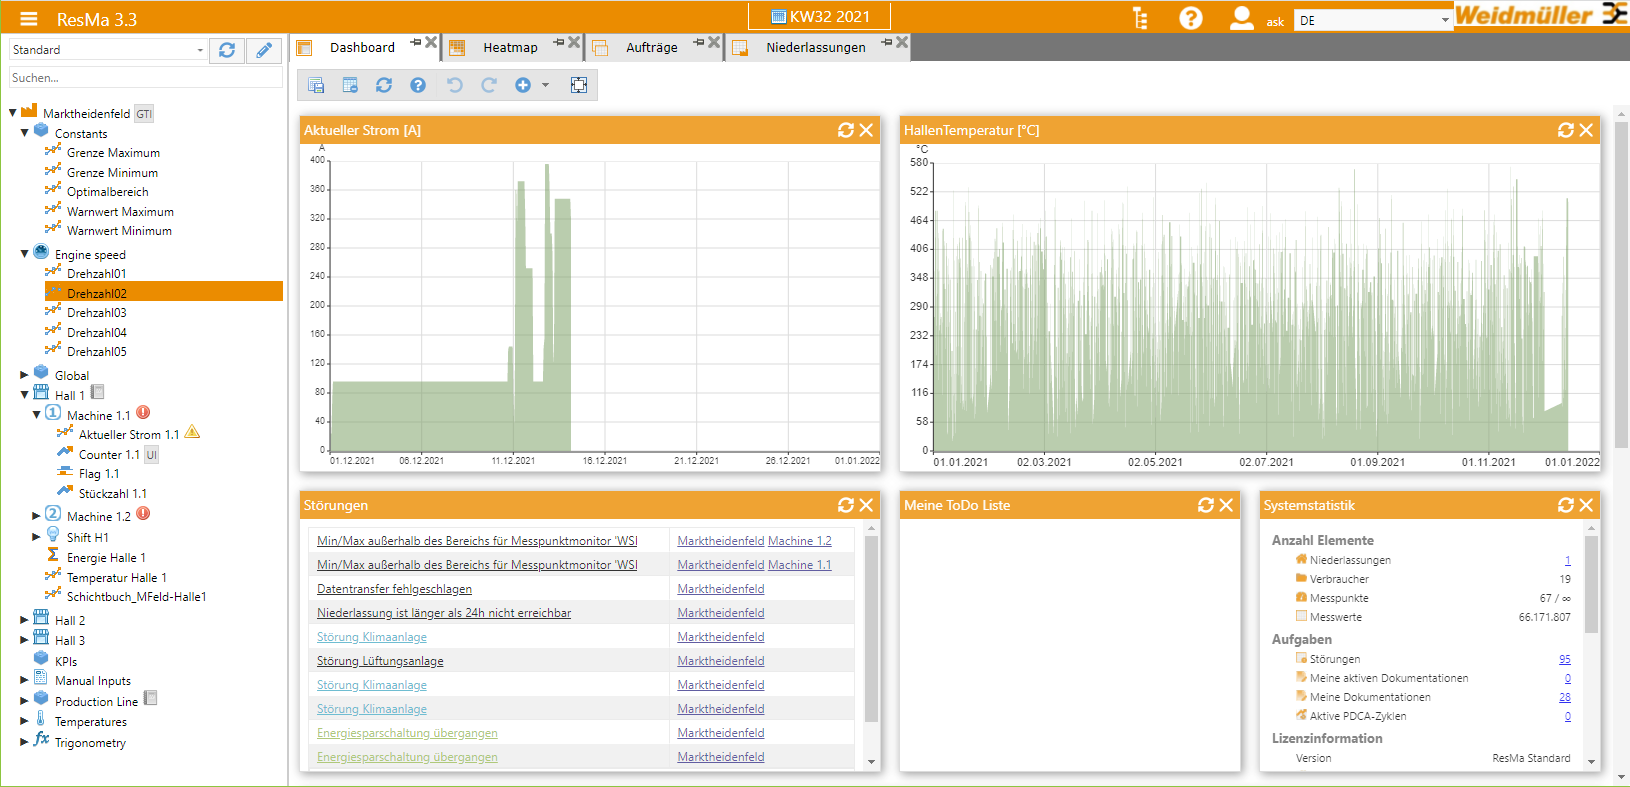
The ResMa® user interface can be divided into three main sections. At the top is the title bar. From left to right, the title bar contains the navigation button and the current ResMa® label. The navigation button opens the ResMa® main menu, which provides access to all software functions (APP selection). Depending on the licensed packages, the available function selection may vary.
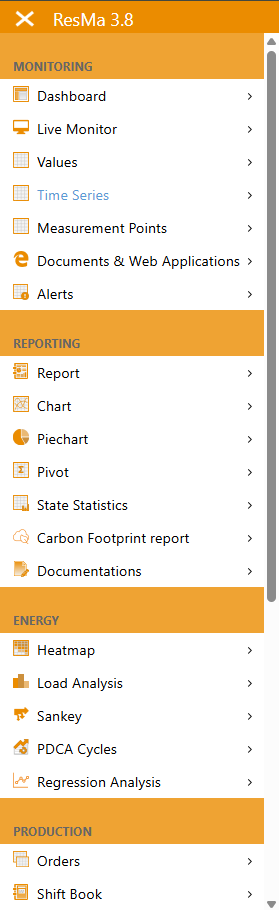
The function selection is divided into the following areas:
Monitoring
Reporting
Energy (if licensed)
Production (if licensed)
Configuration
Next to it is the selection of a global time range. On the right edge you will find the following buttons from left to right:
Show/hide the tree display
Opening the Help dialog
Switching between German and English. Additional languages can be added individually.
User Login
Below the title bar, there are two additional sections: Views and Content. The content section occupies most of the page. Content can include charts or reports. To the left, there is a collapsible tree view.
On the far left, navigation is provided for selecting various analysis options and, where available, their submenus.
Structure of the object tree
All objects relevant to ResMa® (branches, consumers, measuring points) are displayed in the object tree. The tree view also provides selection options for the perspective in which these objects should be displayed.
The following views are selectable:
Standard
This view shows locations (branches) and the mapped processes, with an appropriate hierarchy from consumers down to the actual measuring point. It therefore represents the structure of the data configured in ResMa®.
Connector
The Connector view provides an overview of which data collectors feed data into ResMa® and the corresponding assigned data points.
Resources
Here, you get an overview of the configured media (e.g., electricity, gas, etc.) and can further subdivide them. It is also possible to display and save resource flows using a Sankey diagram.
Cost centers
View for mapping the cost center structure of branches
Structure of the content page
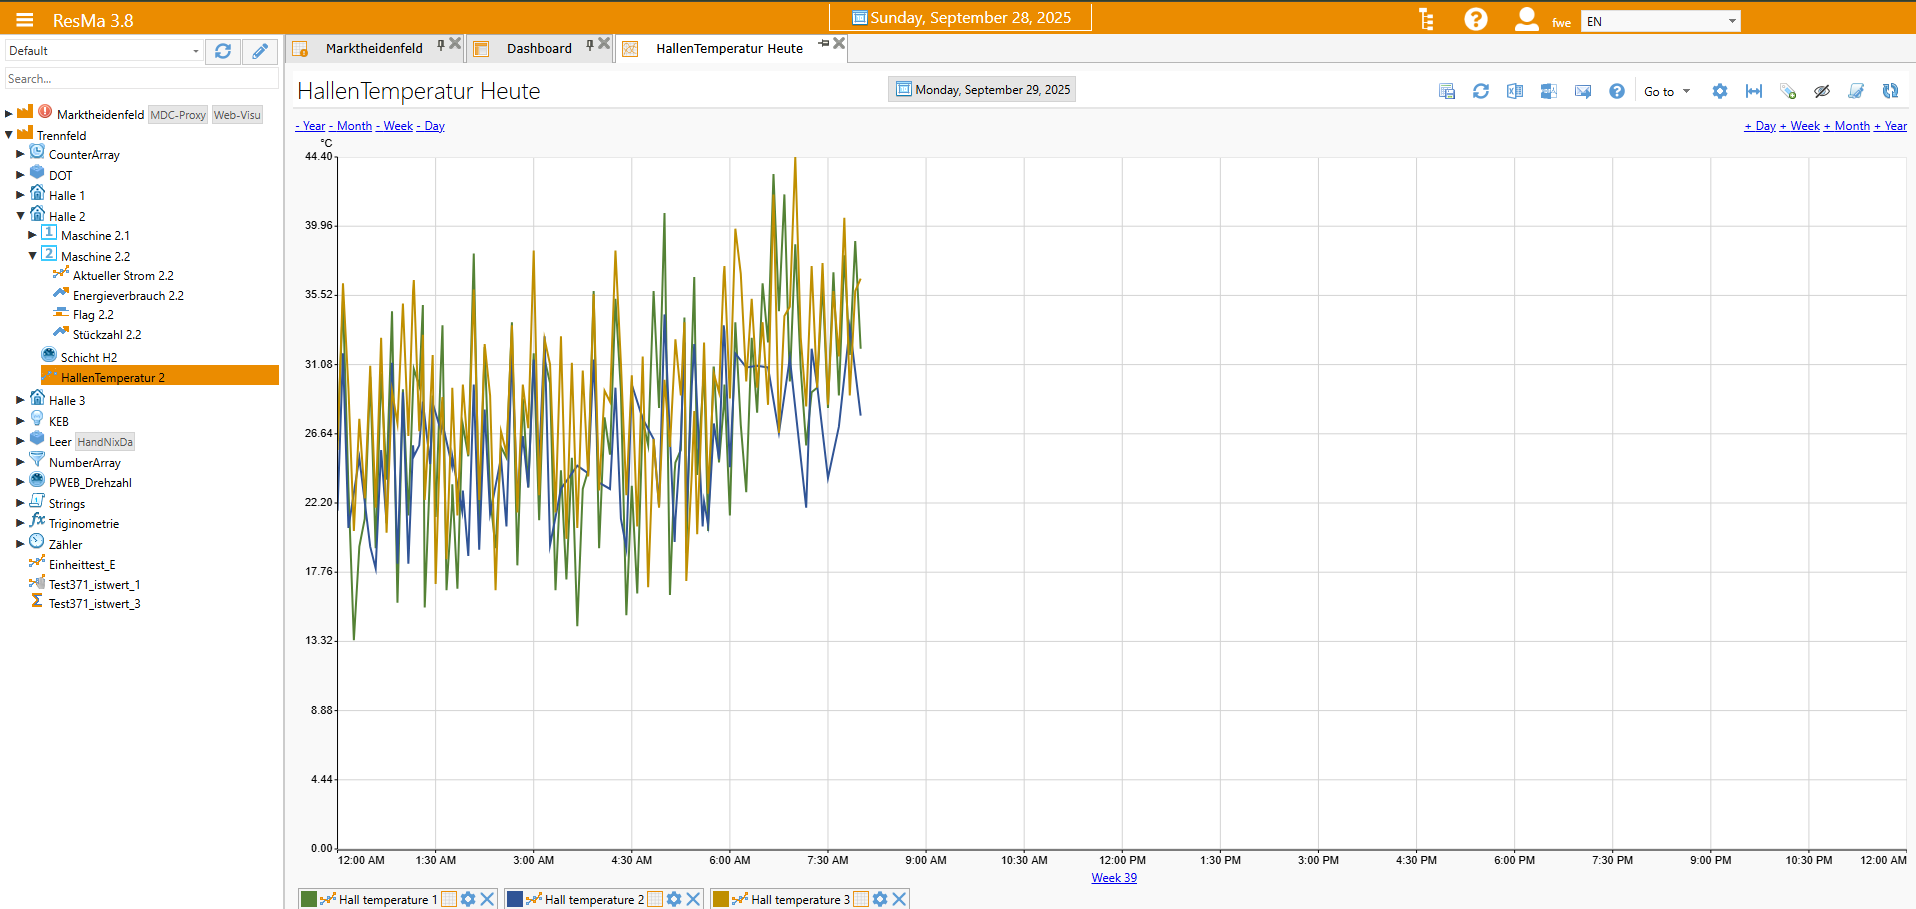
A content page always opens a new tab in the content area and occupies the corresponding space. The tab arrangement can be adjusted using Drag & Drop. The structure of such a page is generally consistent. At the top, there is always a time selection, either as a predefined selector or a calendar. Below that, a content-specific toolbar is displayed on either the left or right side. The actual content, such as a chart, is shown below it.
Tabs in the workspace can be pinned so they are immediately available the next time the system starts. However, this can lead to significantly longer loading times.
Time selection
In the system there are two variants to establish a time reference for functions/APPs:
Global time selection in the title bar
APP-local time selection in the APP tab
For an APP, the local time selection is applied by default. In PROFILES, however, it is possible to reference the time selection from the title bar, which enables the same time reference across multiple windows.
Structure of a dialog
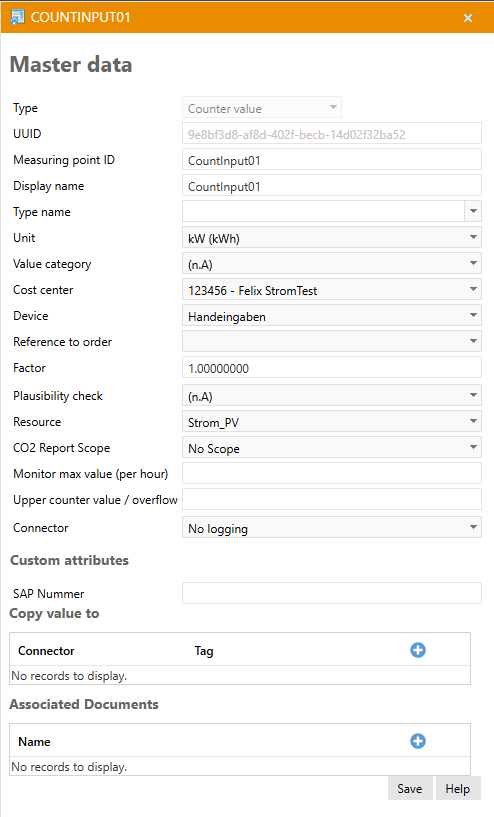
Dialogs in ResMa® are displayed whenever properties of an element are shown (e.g., master data of a measuring point). This dialog contains context-specific content. Standard elements are always displayed in the upper section, followed by user-defined attributes if configured. For measuring points, additional special elements (SAPNUM) are shown below the user-defined attributes.
Function selection (APPs) and standardized functions
The APPs called up via the main menu generally open in the right-hand workspace. A function bar is displayed, which offers an APP-specific selection of functions. Some of these functions are available for every APP and will therefore be described in more detail here.
The vast majority of these APPs support the storage of PROFILES, i.e. saved settings for self-configured views. This means that once created views (e.g. a diagram of all important measured values of a heating system from the last month) can be selected again at any time. This function will also be described in more detail here.
Function bar (Toolbox)
Each APP has a function bar that offers app-specific functions in addition to generally available functions. All generally available functions are described here.

 Save the current view as a profile
 Reset current view
 Refresh the view
 Export to Excel (.xls format)
 Export as a *.pdf file
 Configure automatic sending
 View help for this APP
 Create a direct link (available in LiveMonitor and manual entries)
The functions shown below are APP-specific and are described in the chapter of the respective APP!
Saving Profiles
When profiles are stored, in addition to the name, their availability to other users is configured. This is to be shown here using the example of a diagram:
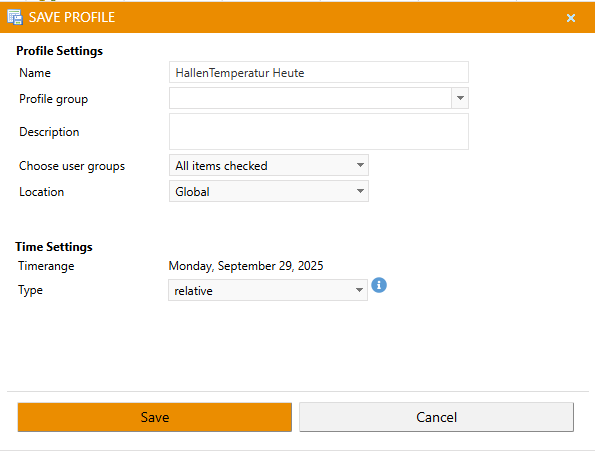
The name of the profile must be entered here.
A profile group can be optionally entered or selected from the existing ones to have an outline in the later profile selection.
A description is also optional.
Locality defines who can view and open the profile:
Local: only the creator can access the profile
Branch office: anyone associated with the selected branches can access the profile
Global: Anyone can access the profile
The time range is the time range currently set for this view
When it comes to time, there are also three different options:
Absolute: Every time the profile is called, exactly the currently set time range is used
Relative: Each time the profile is called, the time range is adjusted accordingly (e.g. always “today”, “yesterday”, “last week”)
Global: When calling the profile, the globally set time range is used
Note
If the “Week” time range is selected for the profile, the profile may open with a different week depending on the language used.
This is because the definition of a week can vary between languages (e.g., in Germany the week starts on Monday, while in the USA it starts on Sunday).
The profile indicator shows whether the profile can be used by all users (Global availability = green) or whether it is a private profile.
Note
To continue editing a newly saved profile, close the chart after saving and open the new profile. Otherwise, ResMa® assumes that another new profile is being saved.
Automatic export
If a profile is stored for an APP, you have various options to export this view or the associated data automatically and cyclically.
For this purpose, automatic sending can be configured in many APPs:
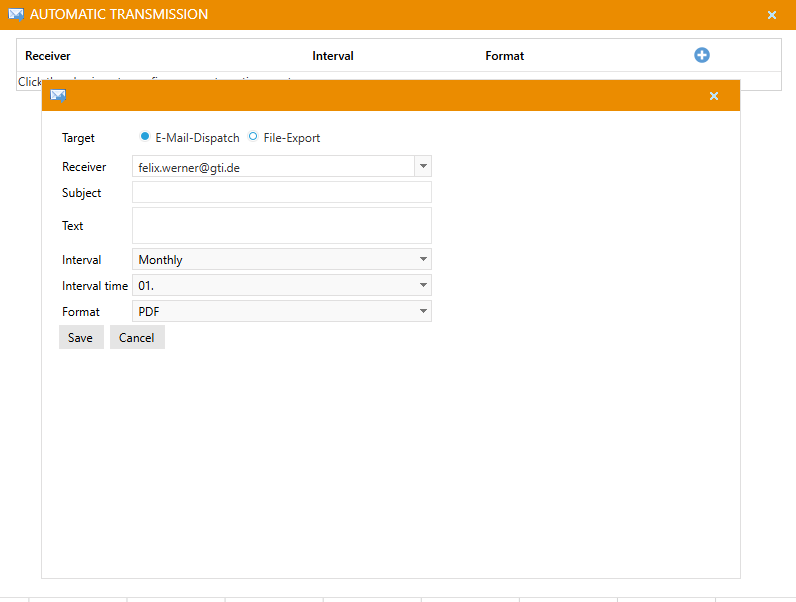
Here it is possible to send the view to different recipients. The type and time of export can be defined individually for each recipient.
Attention
For automatic export by e-mail to work, the e-mail settings under “System” must be configured correctly.
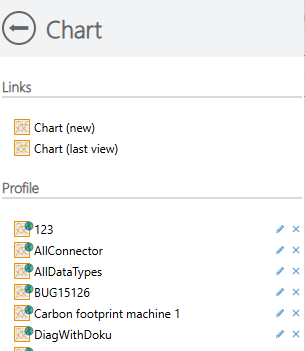
Create direct link
It is possible to create direct links for existing profiles. First, open the APP you want to create a direct link for.
Click the Create direct link button. The link creation dialog opens.
The profile selection dropdown will display the current profile by default. However, it is possible to switch between the app’s saved profiles.
The link area contains the direct link to the corresponding profile. By clicking on the Copy link button, the displayed link is copied to the clipboard and can thus be conveniently used to create a shortcut on the desktop or a favourite entry in the browser.
For security reasons, the direct links no longer contain any login information.
For this purpose, as is usual for web applications, the mechanism of the respective browser can be used to create a comfortable and fast login experience.
If you try to access the direct link without being logged in, ResMa will redirect the call via the login. The functionality of modern browsers can be used to autofill the credentials.