Event log
Overview
The event log is the chronological recording of system events, activities or states that occur within PROCON-Connect. It serves as a central source of information for monitoring, analysing and troubleshooting processes and system states.
The event log is stored in the working memory by default. The number of entries is limited to 1024 entries. If this number is exceeded, the oldest entry is overwritten. This event log is cleared when the system is restarted.
The event log can also be written to a file. This enables evaluation despite a restart. The configuration of the recording is described below.
Both versions of the event log can be downloaded to the client using the download functions.
Navigation
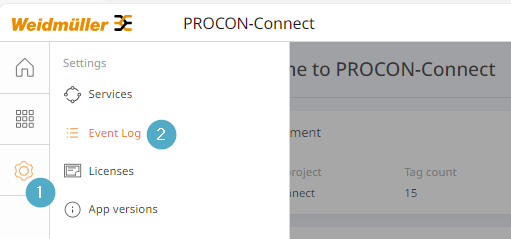
Click on the cogwheel (1) to open the submenu for the settings.
The event log (2) can also be found here.
Event log
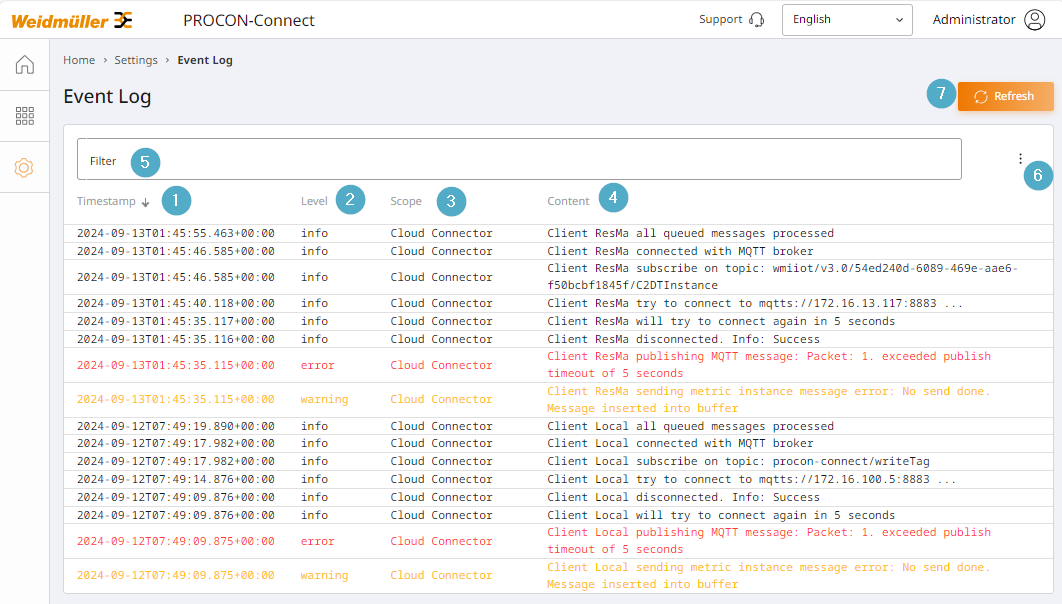
The content of the event log can be sorted by clicking on the respective column header.
Timestamp: Date and time at which the event occurred.
Level: Event level of the event with the respective color assignment.
Area: Assignment to the individual areas (Cloud Connector/Driver/History/System Management/Telemetry) within the system in which the event occurred.
Content: Brief description of the event.
Filter: Within the events, you can filter according to the criteria entered here. If several filters are entered, all criteria must apply.
Export menu: Configuration of file recording and download options.
Update: New events are added to the list.
Download
There are two download options:
Download the event log currently displayed and stored in the working memory.
Download the event log file if a corresponding recording has been configured beforehand.
Both variants are downloaded as a text file via the browser.
Configure file logging
The content of the displayed logs, as well as the files, can be configured individually.
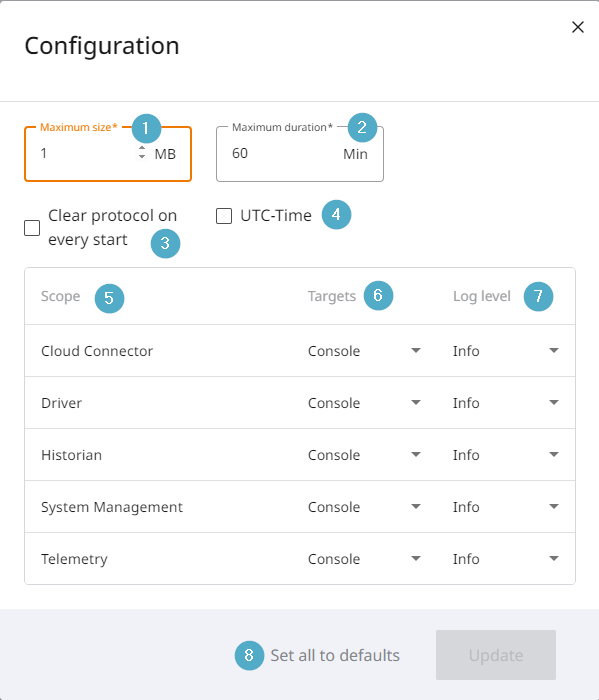
Maximum size: Maximum size of the log file in MB. If this is exceeded, the oldest entry is overwritten on a rolling basis.
Maximum duration: Maximum duration of logging in the ‘Trace’ or ‘Debug’ levels before the system switches these level configurations back to the ‘info’ level.
Delete log: When activated, the event log file is deleted when PROCON-Connect is started.
UTC time: When activated, the timestamp is specified in UTC time, otherwise in the local time of the executing environment.
Area: Overview of the individual PROCON-Connect services that are monitored.
Destinations: Specify whether the events from the respective service should be saved. The configuration allows either no recording, recording in the working memory or in a file. If file is selected, logging also takes place in the working memory.
Log Level: Select from which LogLevel the events are to be saved (Trace / Debug / Info / Warning / Error / Critical).
Reset: Reset the values to the default.
Log levels
The differentiation by log level is also shown in colour.
Trace (grey)
Debug (grey)
Info (grey)
Warning (yellow)
Error (red)
Critical (red)