Data
General
The editors and configuration options for data management, data records and XY curves as well as the associated views and data sources can be found in the “Data” component.The following services are to be configured:
Management of data, e.g., for recipes or orders
Logging of process values in the sense of a data recorder
Management of curve data (XY curves) recorded by a controller for display in a chart
Not all targets (servers) support all the functions described below. This range of functions is only possible in the SCADA variant (Windows) without restrictions.
Configuration
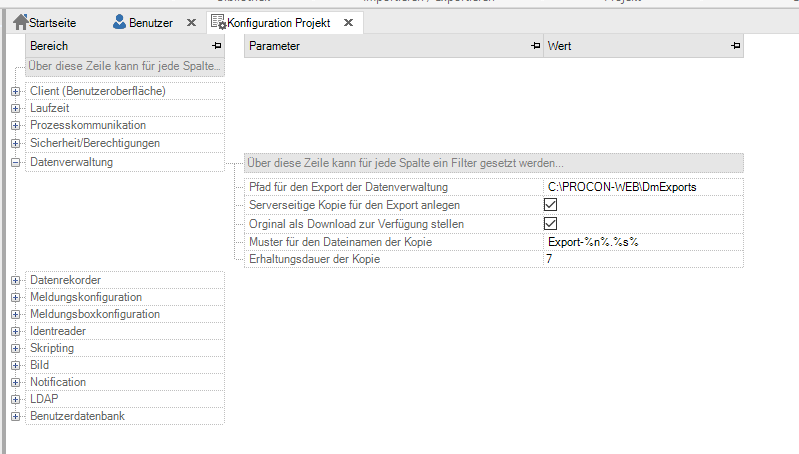
Exporting data from the vault or data recorderis basically done via a download of the export file by the client.In order to be able to process export files individually on the server, there are settings options for data management and for the data recorder. Here the location and the Configure parameters of a copy of the export.
Configuration of the data management
Key name |
Value |
Meaning |
|---|---|---|
Path for the export of data management |
Path |
Absolute path or relative path to the project directory. Not existing paths are created automatically. If the export is done to the folder C:PROC PROCON-WEBProjects[Projektname]\DataManage mentExports. |
Create Server-Side Copy for Export |
Default value: no |
Optional creation of a copy of the export file for individual Use on the server |
Make the original available as a download |
Default value: yes |
Optional suppression of the download to the client |
Copy filename pattern |
Aufbau des Dateinamens der Kopie. Hierzu gibt es folgende Aliase: %n% = Ansicht, %g% = Name der Datenverwaltung, %c% = , %y% = Typ, %s% = Datei- suffix. Das Muster „Expor t-%y%-%g%.%s%“ würde die Datei „Export-Recipe- Printing.xml“ generieren. |
|
Copy retention period |
Default value: 0 |
Maintenance period of the data in the export path in days. 0 means that in is not deleted from this folder. |
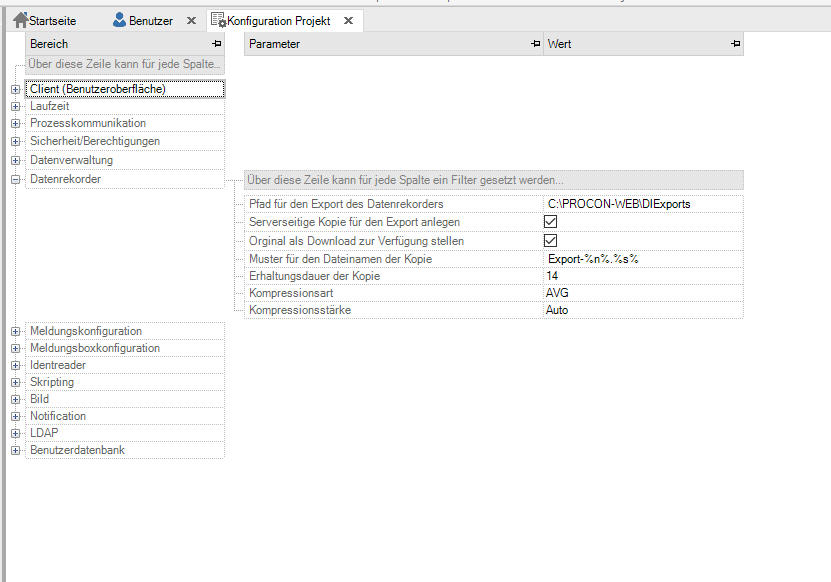
Configuration of the data recorder
Key name |
Input |
Meaning |
|---|---|---|
Data Recorder Export Path |
Path |
Absolute path or relative path to the project directory. Not existing paths are created automatically. If the export is done to the folder C:PROC PROCON-WEBProjects[Projectname]\Export Data. |
Create Server-Side Copy for Export |
Default value: no |
Optional creation of a copy of the export file for individual Use on the server |
Make the original available as a download |
Default value: yes |
Optional suppression of the download to the client |
Copy filename pattern |
Structure of the file name of the copy. There are the following aliases for this: %n% = Recorder Name, %c% = Client, %t% = Timestamp, %y% = Type, %s% = FileSuffix. The pattern “Expor t-%n%-%t%.%s%” would return the file “Export |
|
Copy retention period |
Default value: 0 |
Maintenance period of the data in the export path in days. 0 means that in is not deleted from this folder. |
Type of compression |
Selection Min / Max / AVG |
Compression type for numerical curves that are created at runtime. Logical and character strings are the most common expression |
Compression strength |
Selection Automatic / None / 1 second / 10 seconds / 30 seconds / 1Minute/5 minutes/15 minutes/30 minutes/1 hour/4 hours/8Hours / 1 week / 1 month / 6 months |
With the automatic compression strength, the server calculates thWidth of the chart, taking into account the greatest possible resolution, that fixed intervals must be formed since the zero point. With Boolean trends and string trends will always be the Compression Strength “Automatic” used. |
Data source (only SCADA)
Im Normalfall werden alle Daten der Datenverwaltung und der Datenrekorder im integrierten SQL-Server abgelegt. Hierfür müssen keine Datenquellen angelegt werden.
To store the data of the data management via ODBC in other databases or formats, a data source must be defined. This means that XML or CSV files can also be accessed using the ODBC driver.
Today data sources can only be created in the Windows (SCADA) variant since ODBC drivers are only available for Windows!
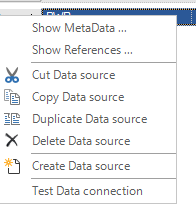
A new connection is created via the “Create data source” context menu.

The columns for defining data sources are explained in more detail below.
Name: Name of the data source.
Driver: The associated ODBC driver is selected in the “Driver” column. This must be installed on the PC for this. However, this only works if the data source is available on the same PC.
Server: Name of the server
Database: The name of the database into which the data is to be written via the ODBC connection is specified under the “Database” column. A path is not required for connections to an SQL server, and the path for the databases is not evaluated in the project configuration!
This is different for file-based connections (e.g., Microsoft Excel driver xls).There are three configuration options:
No path for the database is entered in the project configuration and only the file name is entered in the Database field. The file must be in the project path
A path for the database is entered in the project configuration and only the file name is entered in the Database field. The file must be in the specified directory!
A path for the database is entered in the project configuration and a path including file name is also entered in the Database field. The file must be in the path entered in the Database field! The path entered in the project configuration is ignored!
Username and password: Username and password must be specified if this is expected from the ODBC connection. In the case of file-based ODBC connections, there is usually no need to specify a username and password.
Note
If no username and no password are entered for an SQL server connection, the database is accessed in Windows authentication mode. If the username and password are entered, the SQL Server authentication mode is used.
Rows, columns, and length In the ODBC restrictions, the number of rows, columns, and the maximum number of characters per cell are specified for the respective ODBC driver.
For each data type definition with ODBC storage format, a table is created in the database in the runtime system when a data record is saved for the first time. The table name and the structure are identical to the data type definition
If column names (max. 63 characters) are explicitly assigned in the data type editor, the corresponding table is generated in the database with these column names. If the table already exists, changing the column names can make it incompatible with the data structure in the project. The consequence is that the structure of the table must be adapted. The user is responsible for this
Right-click context menu: Additional options for editing a data source are available via the context menu of the right mouse button.
Testing the ODBC connection can only work if the data source is on the same PC on which the Designer is used.
Data management
The data management is used to save and play back data records while the application is running. For example, the following tasks can be implemented:
Management of machine settings or recipes
Manage orders
Logging of order processing or batches
The data management is usually implemented via various application-specific tables in the SQL server of the runtime system (PROCON-WEB server), or via ODBC via other data sources. An extensive range of script functions and functions, e.g., for buttons, also allow complex database applications to be implemented. The convenient option of defining different views on tables, combined with dynamic filters, supports the simple creation of suitable interfaces.
In der ES-Variante kann die Datenablage nur SQLite erfolgen.
Concept of data management
Data (process values) can be used to a large extent to manage data. This enables functionalities such as recipe or format management to be implemented.
The structure of the data records and the appearance of the print logs are defined using the “Data Management” editor in the PROCON-WEB Designer.
PROCON-WEB supports any number of such structures. They are called data types and given names with a maximum of 31 charactersn.
Functions of data management
All process or data points that are entered in a data type (process variables, texts) can, for example, be saved and retrieved during runtime. The following functions are available for this in PROCON-WEB.Functions of the runtime system:
Selection of a data type and transfer to the default setting
Selection of a data record and transfer to the default setting
Read out the default setting. Create a new data record
View a record
Saving a data record from the running process
Loading a data set into the running process
Printing a data record
Change a data record
Delete a record
Find a record in a database
Reading and writing of a single data record element
Determination of the number of field elements in a data record
Determine the type of a data record element
Definition of data types
A data type is the definition of a table or record structure and is determined by a sequence of tags.
Data type parameters
Parameter |
Description |
|---|---|
Name |
Name of the data type (of the table) |
Number |
Number of elements (records) of the data type (is calculated automatically and indicates the number of entries without the system columns!) |
Data storage |
Specifies the format in which the data type is to be stored. DataServer and ODBC connection are available. |
Header |
You can choose from standard, order and recipe |
Data source |
Only to be selected for ODBC connections |
Key column |
ID from the custom database |
Treat like data recorders |
If the option is deactivated, the process variable list is set up again every time the table is accessed, and a complete refresh cycle is awaited. |
By setting the option, all tags used in the table are permanently kept in the refresh list and can thus be written to a table immediately. The option should be set for data administrations that are accessed very frequently in cycles (<1 minute). |
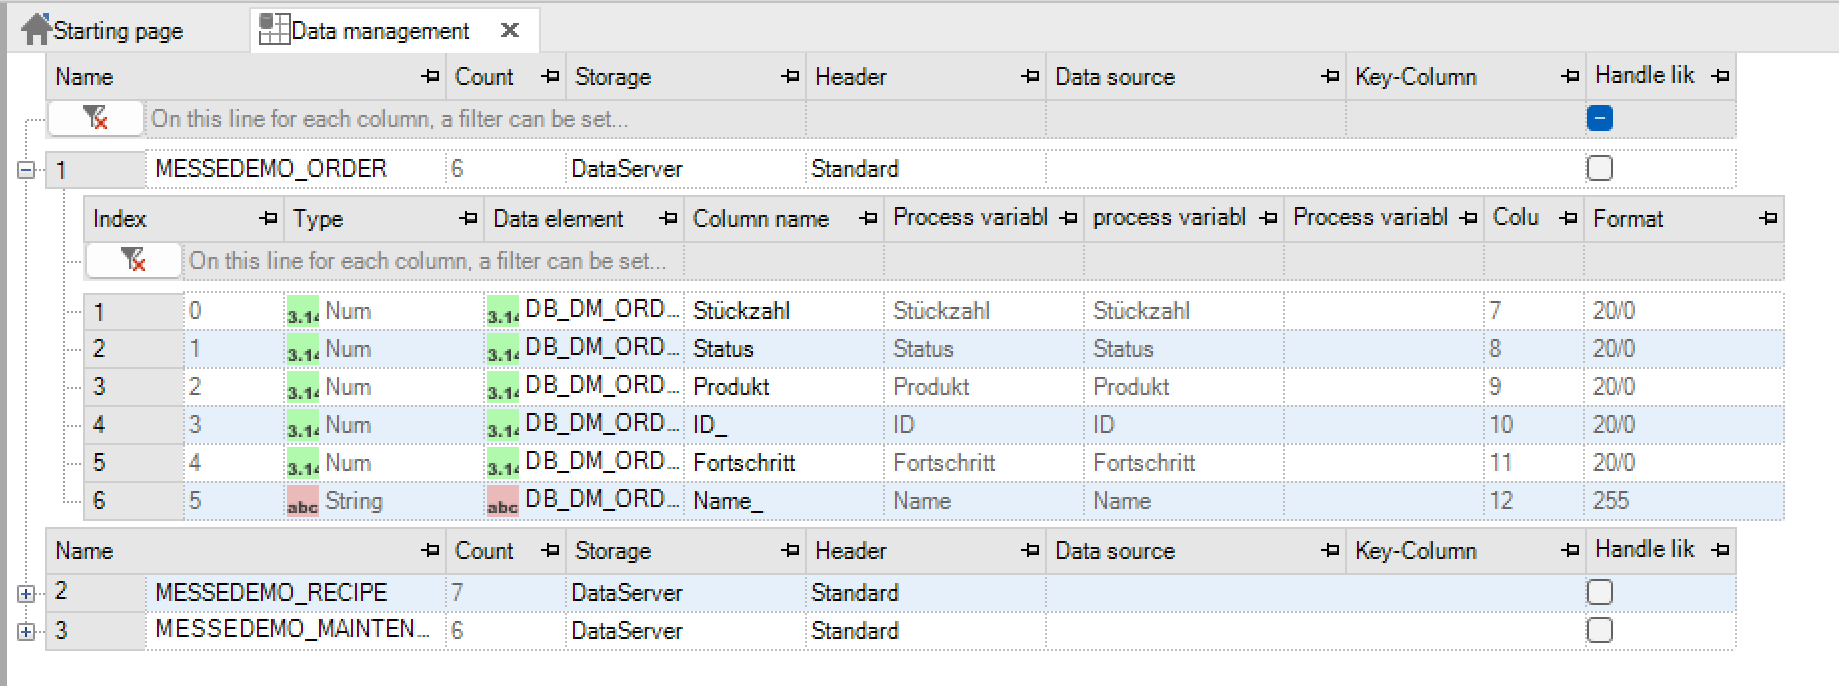
Parameters of the data element
Parameter |
Description |
|---|---|
Index |
Order of the data elements |
Type |
Variable type of the process variables (Boolean, numeric or text) |
Data element |
Process variables whose values are to be recorded |
Can also be from another data management |
|
Column name |
Optional specification of a column name for the data element. This is used in the SQL table and can be up to 128 characters long. Note: With ODBC connections, the length of the underlying database must not be exceeded. For example, it is 128 characters for a column in SQL Server, but only 32 characters in Oracle. The correct length must be ensured when entering data in the designer. |
Comment |
The comment on the day is displayed here (purely informative). |
Display name |
The display name for the day is displayed here (purely informative) |
Display comment |
The display comment for the day is displayed here (purely informative) |
Column |
Displays the column in the database table. Due to system-related meta info, the column number can differ from the number of tracks |
Format |
Information on the format (length) of the entry |
Important
A data element is inserted at the point where the input focus is. If the focus is on the 2nd element and a new element is added here, the newly inserted element is given index 2, the old one is moved to index 3. To insert an element at the end, the data management must be selected.
Storage format of data structures
DataServer
A separate runtime database for the current project is created for each project. The data management tables are stored in this SQL database. The data types that can be configured in the data management are stored in the PWR database as separate SQL tables with the identifier “DM” in front of the name (“DMRecipe”), with each variable representing an extra column. There is a limit for the SQL server, according to which a table may have a maximum of 950 columns.
This means that a data management system can contain a maximum of 3800 columns. If the 950 columns are exceeded when creating a data management system, a second table is created; this division is always made according to 950 columns until the maximum size is reached. The identifier “_part” [number] is appended to the name so that the first part in the above Example is called “DmRecipe_part1”.

Important
Subsequent processing of data management is easily possible with SQL databases. When adding variables, the standard value of the variable is entered in the existing data records.
ODBC
As a storage format, PROCON-WEB can also use its own databases via the ODBC interface. The prerequisite for this is the installation of the corresponding ODBC driver for the database in the operating system (see documentation from the manufacturer of the ODBC driver).How to set up the connection is explained in more detail under ODBC connection.
Data management headers
A header is understood to be metadata such as the creation date and the modification date, which are saved in a data record to enable changes to be tracked.Which metadata is contained in the header is in the point Data management views described
Integration of data management in the application
Data management functions can be executed or triggered via the user interface. For this purpose, events such as selection or the like are required for the table display to configure. Functions such as loading or saving data records can be assigned to buttons (data record function category).
A much wider range of functions is available through scripting. This includes:
Data management functions
Functions for recipe management
ODBC functionsThis provides very efficient functions for realizing complex database applications.
Data management views
In PROCON-WEB, views were introduced to display a direct mapping of a database table or part of a database table as a scrollable and filterable table (GridControl) in the surface. Views are used by the data grid control, which is used in images.
The views were implemented based on views from known data management systems. The prerequisite for creating a view is at least one existing type of definition (data structure) in the project to which the view should point.
The definition of views has the advantage that these can be defined globally. This means that different instances can be created from the images of a data grid class, which then reference the respective views. Another advantage of the view is that the view can be implemented independently of the database structure. This means that the display of the columns in a view can be changed at any time without having to change the structure of the database.A view consists of different view elements, which correspond to the respective columns of the data management. The PROCON-WEB system columns, which are only used as a display in the view and cannot be edited, are also considered. These system columns can vary depending on the data storage (DBASE, ODBC). The possible system columns are shown in the following tables.
The attributes in the header can be manipulated via functions in scripting, see e.g., x5.1 Functions for recipe management. Otherwise, various system functions (such as DBReceive) implicitly update the header entries.
Type Standard
Column |
Meaning |
|---|---|
ID |
Identification number of the tables |
NAME |
The unique name (primary key) of the data set |
CREATEON |
Creation date of the data set |
CREATEBY |
User who created the data record. |
If no user is logged in, this column contains no value. (String “”) |
|
CHANGEON |
Last time the data set was modified |
CHANGEBY |
User who last edited the data record. |
If no user is logged in, this column contains no value. (String “”) |
Typ Auftrag
Column |
Meaning |
|---|---|
ID |
The additional primary key. Is generated by PROCON-WEB. |
NAME |
The unique name of the record |
ORDERID |
Order ID |
PRODUCT |
Product to be manufactured to order |
CUSTOMER |
customer |
ORDERMODE |
Order mode |
SETAMOUNT |
Quantity |
SETUPTIME |
Creation time |
SPECIFIEDSTART |
Defined start of order |
EXPECTEDEND |
Expected end of order |
RECIPEID |
Recipe ID |
COMMENT |
Comment on the order |
ACTUALAMOUNTGOOD |
Current number of faultless goods |
ACTUALAMOUNTBAD |
Current number of faulty goods |
ORDERSTATE |
Status of the order |
ORDERSTART |
Start date and time of the order |
ORDEREND |
End date and time of the order |
ACTUALOUTPUT |
Pieces currently produced per hour |
NOMINALOUTPUT |
Expected pieces per hour |
Recipe
Column |
Meaning |
|---|---|
NAME |
Name of the dataset |
VERSION |
Version number that can be freely assigned |
Possible version elements (structure of the version number is: Major.Minor.Build): |
|
Build = 0 / Minor = 1 / Major = 2 |
|
Standard: 1.0.0 |
|
RECIPESTATUS |
v |
Draft = 1 / Released = 2 / Deleted = 4 / Locked = 8 / InUse = 16 |
|
CREATEON |
Date of creation of the data set |
CREATEBY |
Username who created the data record |
RELEASEDON |
Release date |
RELEASEDBY |
User who gave the approval |
USEDON |
Date of last use |
USEDBY |
User who last used the record |
LOCKEDON |
Date of locking |
LOCKEDBY |
User who locked the record |
DELETEON |
Date on which the record was deleted |
DELETEBY |
User who deleted the record |
CREATEBY |
Username who created the data record |
No Header
Only the specified process variables are saved here. There are therefore no system functions available with which, for example, the last update can be displayed.
If necessary, a filter can be assigned to the views to be able to limit the data displayed in the Data-GridControl at runtime. Filters are described in the chapter Filter.
Create views
The Views area can be found in the project tree under Data-> Data management. Table displays can be configured here, which can be displayed with the GridControl. Several views can be defined for each table.
To create a new view, select the “Add” entry from the context menu and select the data management system to be used for the view. The underlying data management may contain a maximum of 255 columns, although 6 columns are already occupied by the system columns. I.e., there can be a maximum of 249 columns which have been defined by the user. After the data management has been selected, the view is automatically filled with the available data management columns, including system columns. The user only has to assign a unique name for the view.
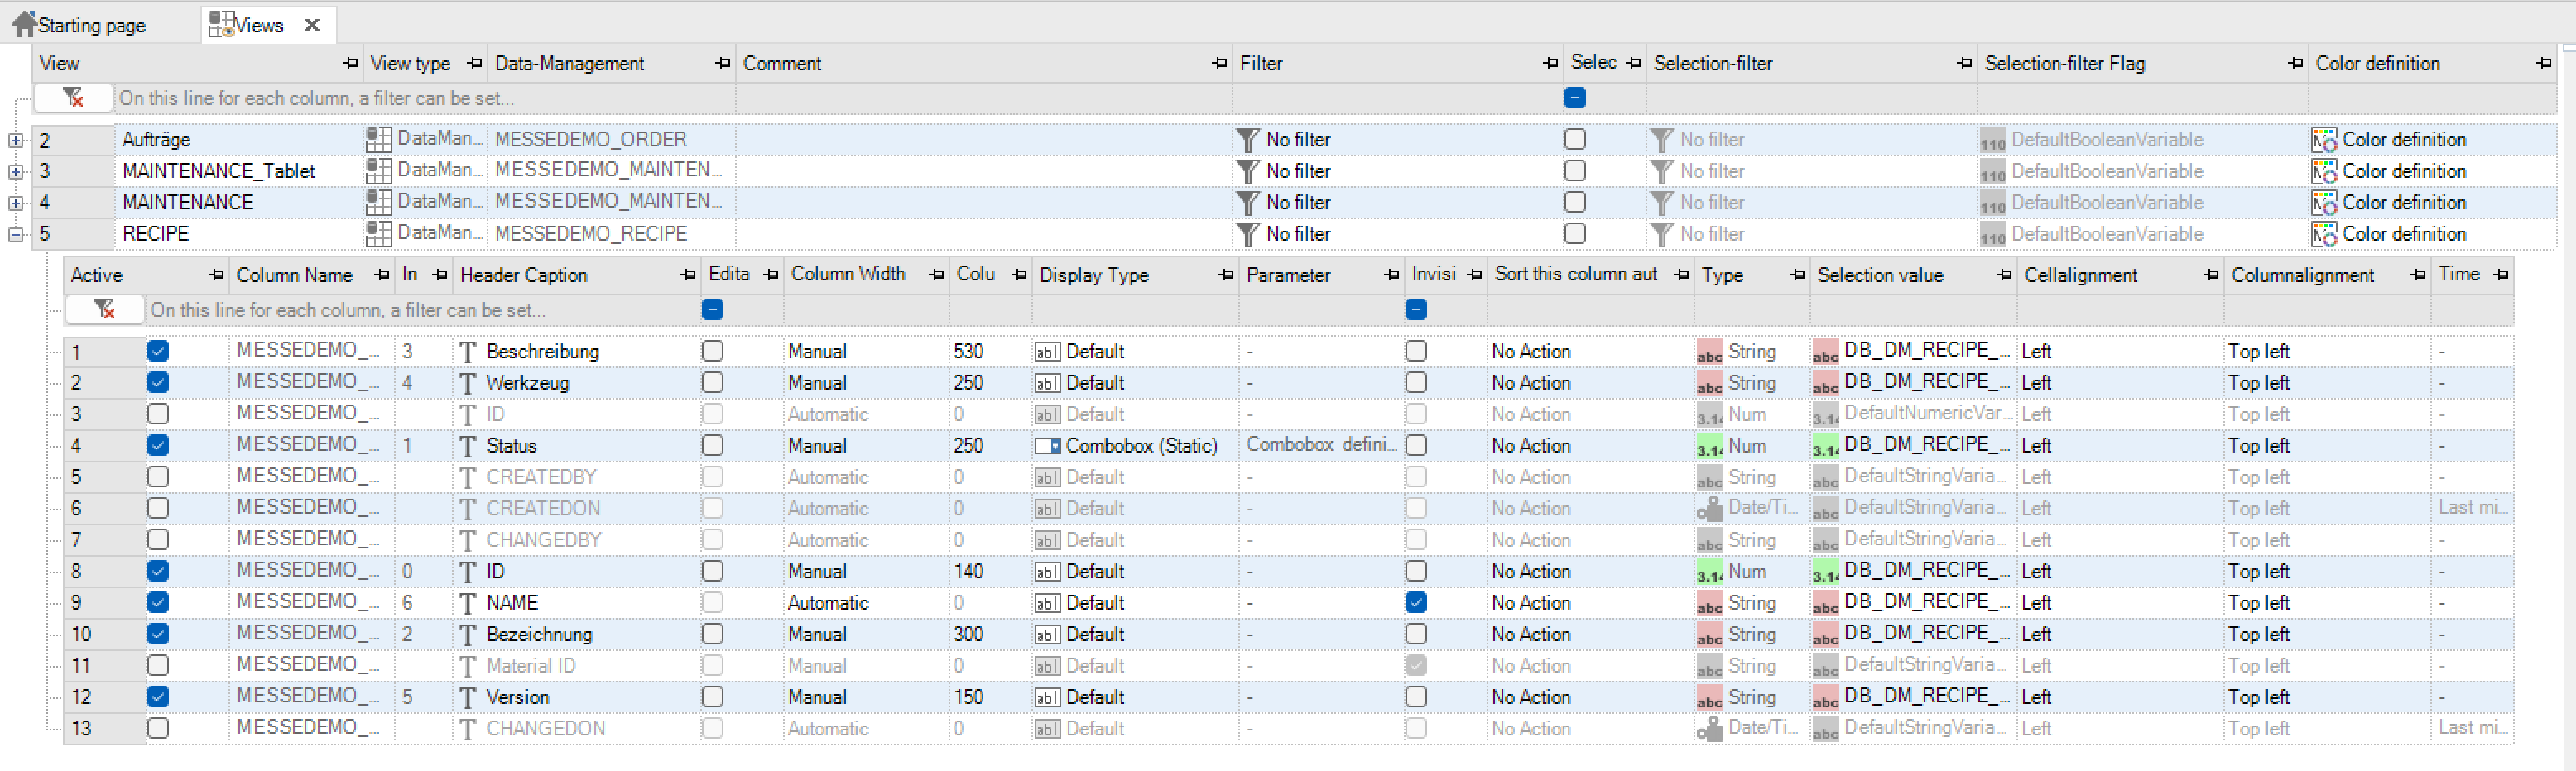
To be able to configure a column, it must first be activated via the checkbox in the “Active” column. Activation also sets a reference to the data element of the data management (deactivation removes this again) and the order of the columns is determined.After activating the column, the following columns can be edited.
Column |
Meaning |
|---|---|
Index |
The index corresponds to the order of the columns. Activation defines an automatic sequence. The order corresponds to the order in which the columns were activated. If the order is to be changed, “Move” must be selected via the context menu option. |
Column overview |
A column heading can be assigned in multiple languages here |
Editable |
Makes a column editable at runtime. |
Editable column width |
Automatic: Automatic adjustment of the column width to the overall picture |
Manual: The next column is activated, and you can enter the column width (in pixels) there |
|
Display type |
usual representation of the data type |
numeric possible |
|
a selection of values |
|
A relation to table can be configured for the representation of a value |
|
Exponential display: Only available if the column corresponds to a num. Process variable belongs. The values are shown in an exponential display (1000 -> 1e3). |
|
Invisible |
The column is hidden at runtime |
Presort column |
Creates a presorting in ascending or descending order |
Type |
Indicates the type of column |
Selection value |
Variable that is written with the cell value when the row is selected (e.g. to transfer the record parameters) |
Cell alignment |
Left justified, center or right justified |
Column alignment |
Representation within the column (e.g., top right) |
Time range |
Time ranges which should be selectable in the runtime can be defined here |
Views have a simple reference to data management. If elements are deleted in the data management, the view is updated accordingly if no view element has been activated. When the view element is activated, there is a direct reference between the data management element and the view element and can therefore not be deleted. If a data management element is to be deleted, the view element must first be deactivated, or the view deleted.
Configure views
A view consists of several columns in which configurations such as name, filter, etc. can be made. The following section describes the configuration options in detail.
Naming
The name of the view must be unique. This name is used for selection in the table display in the image overlay and does not have to correspond to the name of the data management.
View type and data management
The view type indicates the type of data management that the viewpoints to. The data management, alert (for alarm list) and audit trail (logbook) types are available (depending on the component).
The name of the data management to which the viewpoints is specified in the Data Management column. View type and data management can only be assigned when the view is created. After that, configuration is no longer possible; the columns are then used for display to the user.
Comment
The Comment column is used to store further information about this view (eg “This view defines all active orders”) for the project manager. Comments of up to 255 characters can be entered.
Filter
A filter for this view is referenced in this column. The creation of filters is described in Chap. “Filter” explained.
A filter has the task of filtering an existing amount of data according to certain criteria. These filters can also be deactivated dynamically at runtime and the filter criteria adjusted. To select a filter, the dialog button must be clicked in this cell. This opens a list of all filters that have been created for the corresponding data management. The following is an example of a filter application. There is a data management for orders.
Example table order:
ID |
Order name |
Progress |
RecipeID |
|---|---|---|---|
1 |
Order1 |
10 |
1 |
2 |
Order2 |
15 |
2 |
4 |
Order4 |
50 |
4 |
8 |
Order8 |
120 |
1 |
All orders with an ID value greater than 3 should be displayed. The following table results.
Order table after filtering:
ID |
Order name |
Progress |
RecipeID |
|---|---|---|---|
4 |
Order4 |
50 |
4 |
8 |
Order8 |
120 |
1 |
Selection filter:
Filters can be used not only to filter certain entries, but also to explicitly select a data record according to certain criteria. The first record found is selected.
To specify a selection filter, the checkbox must first be activated in the “Selection filter active” column. This activates the two additional columns.
The corresponding filter can now be selected in the “Selection filter” column. The same rule applies here as with the normal filter: Only one filter can be selected that belongs to the corresponding data management.To be able to use the selection filter at runtime, the so-called “selection filter flag” is configured. This flag corresponds to a logical process variable. As soon as this variable is set to 1, the selection filter is activated, and the corresponding lines are displayed. The variable is automatically reset by the data grid control after the selection.
In the following section, an example is intended to illustrate how the selection filters work.As in the example with filters, the order management exists again.
Order Table
ID |
Order name |
Progress |
RecipeID |
|---|---|---|---|
1 |
Order1 |
10 |
1 |
2 |
Order2 |
15 |
2 |
4 |
Order4 |
50 |
4 |
8 |
Order8 |
120 |
1 |
A selection filter flag is set at runtime, which is to select the first entry of the data records with ID 4.
After setting, the first entry found is selected.
Order table with selection:
ID |
Order name |
Progress |
RecipeID |
|---|---|---|---|
1 |
Order1 |
10 |
1 |
2 |
Order2 |
15 |
2 |
4 |
Order4 |
50 |
4 |
8 |
Order8 |
120 |
1 |
Selection filter
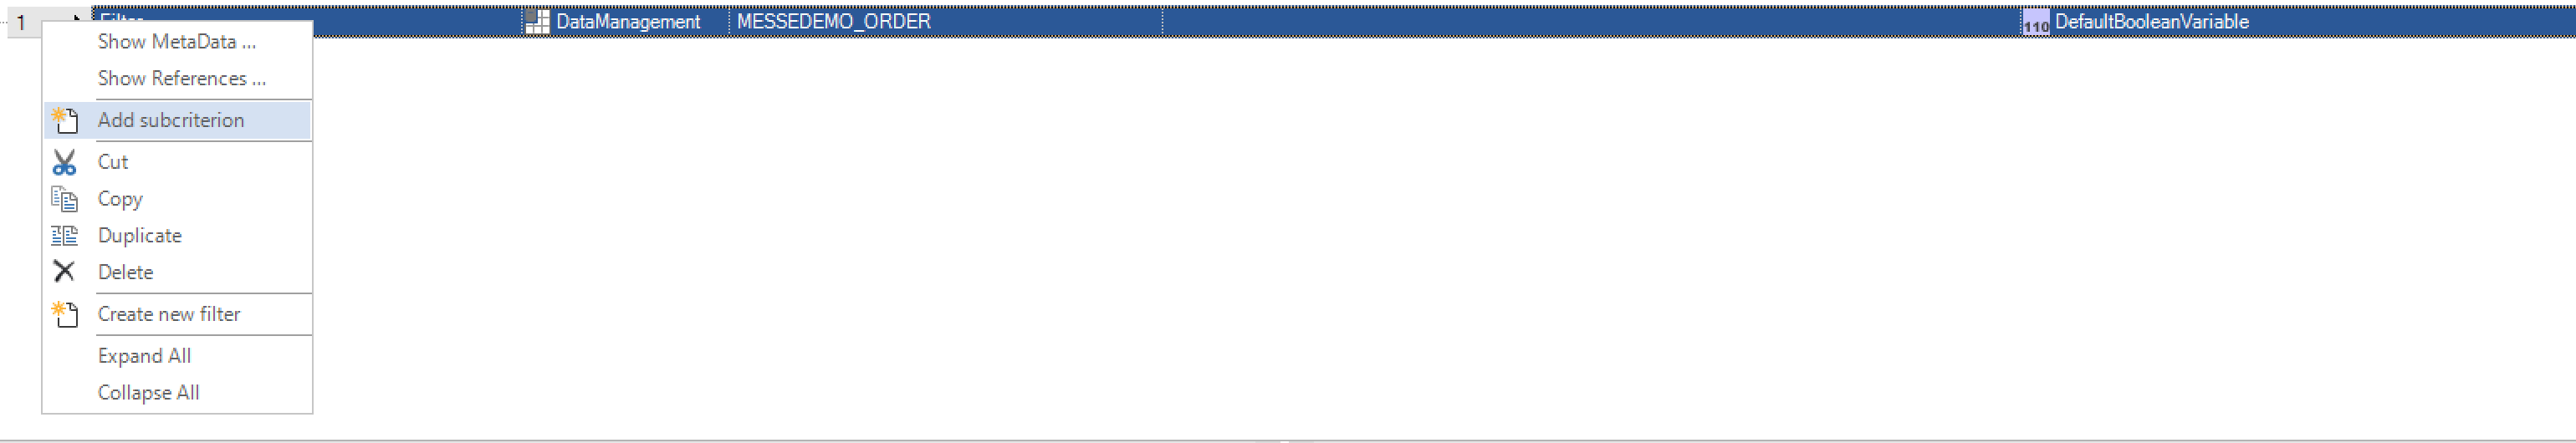
To only display certain messages, a created view can be filtered according to criteria. To do this, a filter must be created and then assigned to the view. Criteria can be added to a filter via “right click / add criterion”. Sub-criteria can in turn be added to individual criteria:
By clicking on the filter, the filter can be displayed as an SQL statement to check what has been configured.
Colour definition
The data can be highlighted in colour in a view for better differentiation. The colouring is possible depending on variables. The colour definition can be applied to both the background colour and the font colour.Creating a colour definition is like creating a filter.
Configuration of the view elements
In addition to the general Configuration columns, every view has the so-called view elements, which are assigned to a column in the database. Configuration options for name, index, column heading, etc., are also available for these elements, which are explained in the following section.
Activate / deactivate view element
The view element is activated with the checkbox in the “Active” column. This activates all subsequent columns. This also creates a reference to the data management element, which means that it can no longer be deleted. If the checkbox in the “Active” column is removed, all data in this view element are reset to default and the reference to the data management element is deleted.
Column name
The column “Column name” is only an indication of the data management element. It is made up of the data management name and the column name. If the data management element (column name or variable) changes, this column name also changes.
Index
The index defines the order of the columns in which they are displayed. If the “Active” column has not been set, this value is “empty”. As soon2 as the “Active” column is set, an index starting with 0 is automatically assigned.If the order is to be changed, the user selects the “Move” option in the context menu of the right mouse button and moves the view element as required. This also changes the index number of the element.
Header
The heading of the view element (column) is defined in this column. This column is defined in several languages, i.e., a separate column heading can be defined for each language.
Note
Column headings can be exported with the text import / export. This means that multilingual column headings can be implemented efficiently, as the text export allows the translation to be carried out independently of the actual configuration.
Editable
“Editable” defines whether the respective column can be edited at runtime. System columns cannot be changed, so the Editable option is not available for these columns.
Important
It is not possible to assign an authorisation level for editing to every column. If it is to be ensured that a user with low authorisation cannot change any data, this should be restricted via the storage functions of the Data-GridControl.
Column width mode
In the “Column width mode” column, you can choose whether the column width should be aligned automatically according to the content (“Automatic” mode) or should align itself manually according to a respective pixel value (“Manual” mode). If the “Manual” mode is selected, the “Column width” column is activated, and a fixed pixel value can be specified.
Important
In the case of screen-independent resolution, the pixel value is not also scaled. Only the width of the DataGrid.
Display type
In the views there are various options for displaying the values of the database column in the data grid. The following section explains the individual configuration options.
Display type Standard
With “Standard” the value is displayed in the grid as it is in the database table. This means that the value is displayed unformatted.
Note
Logical values are shown as checkboxes in the DataGrid control.
Percentage bar display type
This display type only exists for the view Elements that refer to a numeric column. If this display type is selected, the “Parameter” column is activated. The percentage bar can now be defined in this cell.
Note
The Percentage Bar display type always displays the bar on the left. Right the value and the % sign are displayed.
The following parameters can be set:
Parameter name |
Description |
|---|---|
Values type |
Constant: Min and Max values are constant values |
Process variable: Min and Max values are dynamic process variables |
|
Minimum (Constant / variable) |
Constant: The minimum value of the percentage bar |
Variable: The variable that contains the minimum value of the percentage bar |
|
Maximum (Constant / variable) |
Constant: The maximum value of the percentage bar |
Variable: The variable that contains the maximum value of the percentage bar |
Combobox display type (dynamic)
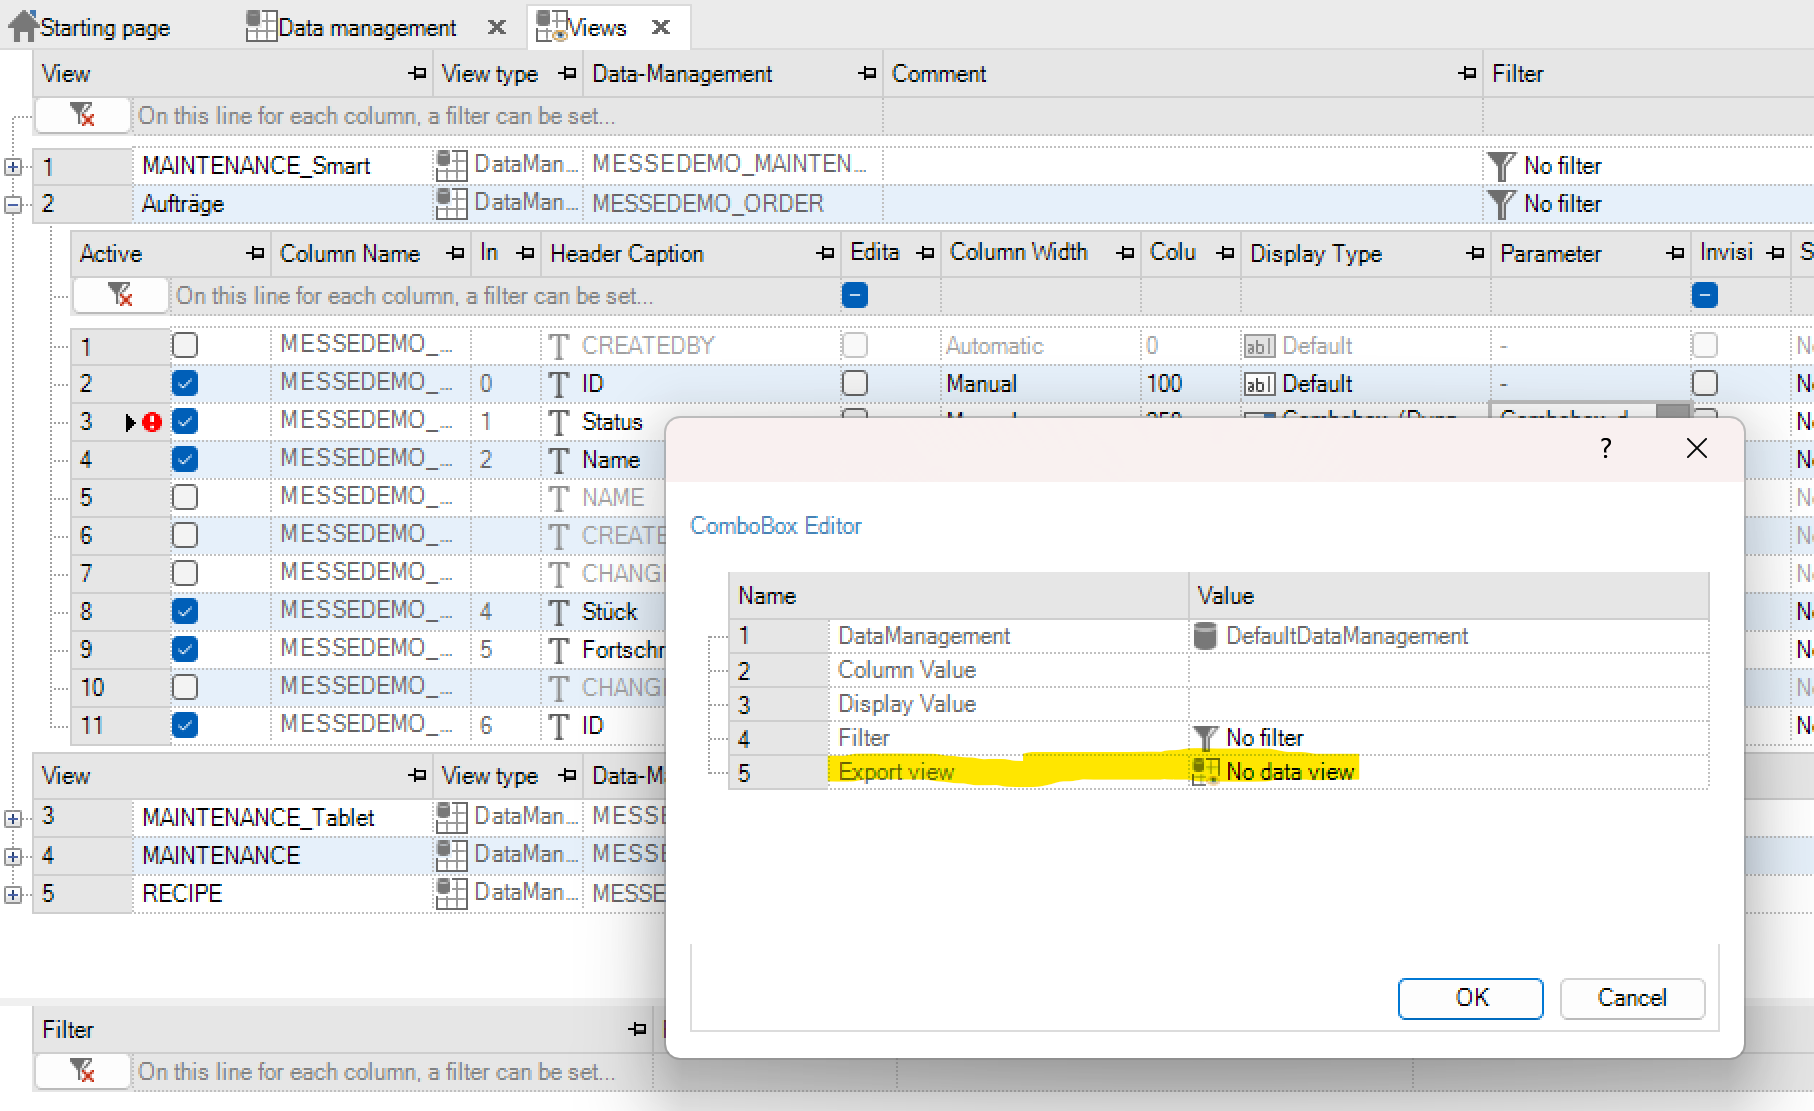
The Combobox (dynamic) display type can be used if two tables are to be linked. In this case, the combo box is a list of elements, the so-called display values. Behind these display values is a column value via which the combo box is addressed. This means that the display value represents the column value at runtime in the Data-GridControl.
To define a Combobox (dynamic) display type, you first must select the corresponding data management that is to be accessed. Furthermore, the column value is selected from the data management and the corresponding display value is defined. Column and display values can also be identical.

A filter can also be defined for this data management to limit the entries in the combo box accordingly. (See also chapter filter).To clarify the function of the combo box (dynamic), an example is shown below.
Application example
There is a table with order data and a second table with recipe data. In the Order data table, the recipe name from the recipe data table should be displayed in the RecipeID column.
Order data table:
ID |
Order name |
Progress |
RecipeID |
|---|---|---|---|
1 |
Order1 |
10 |
1 |
2 |
Order2 |
15 |
2 |
4 |
Order4 |
50 |
4 |
8 |
Order8 |
120 |
1 |
Table of recipe data
ID |
Recipe name |
|---|---|
1 |
Recipe name1 |
2 |
Recipe name2 |
Definition of the combobox:
Data management: Recipe data
Column value: Recipe data ID
Display value: Recipe data.Recipe name
Filter: No filter
Depending on the value of the recipe ID, a text is displayed in the combo box that shows the recipe name in relation to the ID column of the recipe data.
ID |
Order name |
Progress |
RecipeID |
|---|---|---|---|
1 |
Order1 |
10 |
Recipe name1 |
2 |
Order2 |
15 |
Recipe name2 |
4 |
Order4 |
50 |
4 |
8 |
Order8 |
120 |
Recipe name1 |
Important
If the combo box does not contain a value that is defined in the RecipeID column (4 in the example), the value is displayed without a display value. However, no 4 can be selected in the combo box.
In this way, linked tables can be created and exported or imported. To do this, the buttons must be activated in the control bar in the grid.For the view for this linked table must also be selected a view to be exported.
Combobox display type (static)
With the static combo box, fixed list entries are generated for the corresponding column elements of the data management. Images can also be used for display in the combo box.For example, if you have a numerical data element, the combo box could have assigned a, b, or c as display value. For a, the numeric value is 5, b is 6, and c is 10. The corresponding cell then has this value.If this display type is selected, the “Parameter” column in which the static combobox is defined is activated.

New list entries are created or deleted using the “Add” or “Delete” buttons.In the column “Value”, the value is entered which is assigned to the column when selected. The “display text” is the text that can be selected in the grid control. In addition, a graphic can be integrated into the list display with the display bitmap.
Display Type Process Variable Value Numeric
This type of display exists only for the Elements view that references a text. If this display type is selected, the “Parameters” column is activated. For this purpose, a dialog can be opened in which the parameters for min, max and decimal places are set.
Display Type Process variable value bool
This type of display exists only for the Elements view that references a text.
Display Type Process Variable Value string
This type of display exists only for the Elements view that references a text.
Column invisible
This cell describes whether the selected view element should be displayed invisibly. Invisible columns are still considered by selection filters.
Presort column
The sorting of this view element can be configured in this column (no action, ascending, descending).
Important
This setting is already called when the database is loaded and therefore cannot be edited during runtime, or the sorting is not graphically visible in the runtime.
In addition, several view elements can be sorted, the sorting then goes from the first view element (which was sorted) to the last.
Column type
The Type column shows the type of data element. The types of text, date, time, number and logical are possible. The column is purely for display purposes and cannot be edited
Selection value
In this column a variable can be assigned to which the value of the currently selected row (in the data grid) is assigned. I.e., If you select a line in the data grid (runtime), its cell value is written to the selected variable.
Selection filter data
Filters are used to limit certain amounts of data (filter) or to select a line. Generally, filters are divided into filters and sub-criteria. Filter describes the top element under which all other filters are arranged. The data management is referenced in this element and a general (uniform) name for the filter can be assigned here. It is also possible (optional) to enter a comment on this filter. Sub-criteria denote all elements below a filter. All further filter attributes are entered in this element.
Creation of filters
A new filter can be created via the context menu in the lower half of views via the entry “Create new filter”. To add sub-criteria, the filter is selected, and the corresponding sub-criteria is also inserted via the context menu.
Criteria can be nested in up to five levels, ie sub-criteria can be present for each criterion, which can be nested in sub-criteria etc.The filters or criteria can be deleted using the “DEL” key or the context menu entry “Delete”.
Attributes of the criteria
Attribute |
Meaning |
|
|---|---|---|
Index |
The index is first assigned automatically by the system in ascending order (starting with 0). This index describes the order in which the sub-criteria are read. This index can be changed with the context menu via “Move”. |
|
Shortcut |
The link (AND, OR, XOR) is only available between 2 sub-criteria. Ie the first sub-criterion (index = 0) never has a link. If the first sub-element is deleted, the second automatically becomes the first and the link is removed.” |
|
Column |
The column is a combo box with all available data elements (columns of the data management) that are currently defined. The icon in the combo box describes the type of column (String, Num, Log, Date, Time, DateTime). Due to this type of column, the remaining columns are then automatically adjusted. If the columns behind contain configurations, these will be removed and set to default. |
|
Operator |
A total of 12 operators are available under Operator. The usable operators are available depending on the selected column type. |
|
String: “Equal to”, “Not equal to”, “Begins with”, “Contains”, “Ends with”, “Does not start with”, “Does not contain”, “Does not end with”, “in”, “not in” |
||
Numeric: date, time: “Equal”, “Not equal”, “Smaller”, “Less than or equal to”, “Greater than or equal to”, “Greater than”, “in”, “not in” |
||
ogical: “equal”, “unequal” |
||
With the filter “in” individual criteria must be separated with a comma |
||
Value type |
The value type determines column value. Constant or process variable can be selected. |
|
Value |
Depending on the value and column type, a constant value or a process variable can be selected here |
|
Link to sub-criterion |
If the child element has a sub-criterion, this column becomes active and a link to this sub-criterion (group) can be selected (AND, OR, XOR). If the sub-elements are deleted, this column is deactivated. |
SQL-Server-Statements
To be able to test the configured filter, there is a preview of the SQL filter in the lower area of the window.

This shows the SQL statement when the filter is selected. Process variables are identified with <<Variable.VARIABLENNAME>>. The text can be selected and copied and then used in an external program to test the filter. This function is also covered by the view. All you must do is select the appropriate view and the SQL statement (+ filter if available) is displayed.
Data recorder
General information about data recorders
The data recorder in PROCON-WEB is used to log process values over a period of time, ie the data recorder fulfills the task of an xt recorder for the values of process variables. Process values are recorded automatically or event-driven and the data is saved in the project runtime database or in an ODBC data source.
The user specifies the time intervals at which the values should be recorded. Possible grids are milliseconds, seconds, minutes, and hours.
In addition, the data recorder can be used for batch reporting. The text variable containing the batch name must be available in the data recorder and declared as the batch name. The data recorder logs the string value of the text variable. All data with the same string value that are marked consecutively over time form a batch.
The data can be recorded in four different ways by the data recorder:
As PROCON WEB DataServer data storage: the data from all data recorders are saved in the “TagLogs” table in the runtime database (PWR_<ProjektName>). One (changed) value of a process variable is saved at a time.
As classical table: the data of one data recorder in a table (Dl<LoggerName>) are saved in the runtime database (PWR_<ProjektName>).The recorded data can be evaluated, for example, using external database-compatible programs and used in reports, for example.
As an external table: the storage is the same here as with the storage as a data server or individual table, only these are stored in a separate SQL server table. More details on this can be found in Technical Note 004, as setting up the external connection requires its own instructions.
As ODBC data storage: the data from a data recorder are saved in a file or table that can be addressed via ODBC.
A maximum of 1000 data recorders can be defined.
Functional principle of the data recorder
The data recorder works type-oriented and thus corresponds to the model of a classic line recorder. All channels are written on the same paper (= table) with the same feed rate (= sampling rate).When defining a type, the general characteristics of the type, such as recording grid, averaging, file type, etc. are specified and the relevant process variables (logical, numerical and text variables) are assigned. Each process variable can be contained in several types at the same time.To limit the number of file accesses, the size of an internal buffer can be specified for each recording type, which is only saved when the buffer is filled. Optionally, the mean value can also be calculated using this buffer, so that only the mean values are saved and thus the number of records can be kept smaller.
The process value recording can only be closed and time-normalised, i.e., a record can only be written at specified times (in a time grid). If the start of the recording is outside the time grid, the previous grid time is interpreted as the start time.A recording type can be edited either automatically or manually. In the case of the type to be recorded automatically, the logging is started with the start of the DataServer and, if no error occurs, continues until the DataServer is terminated.
A manual recording type can be started and ended again directly via the positive edge of a logical variable. The time entry of a “snapshot” can be set to seconds, minutes, or hours. done exactly. The accuracy is set via the entry “Sampling” in the configuration window.As an option, the data recorder can automatically delete all files of a recording type after n days.
Definition of the data recorder
Data recorders are defined under Data -> Data recorder. The recorder types can be created via the entry “Data” -> “New” or via the context menu. Process variables are also assigned via the right mouse menu.
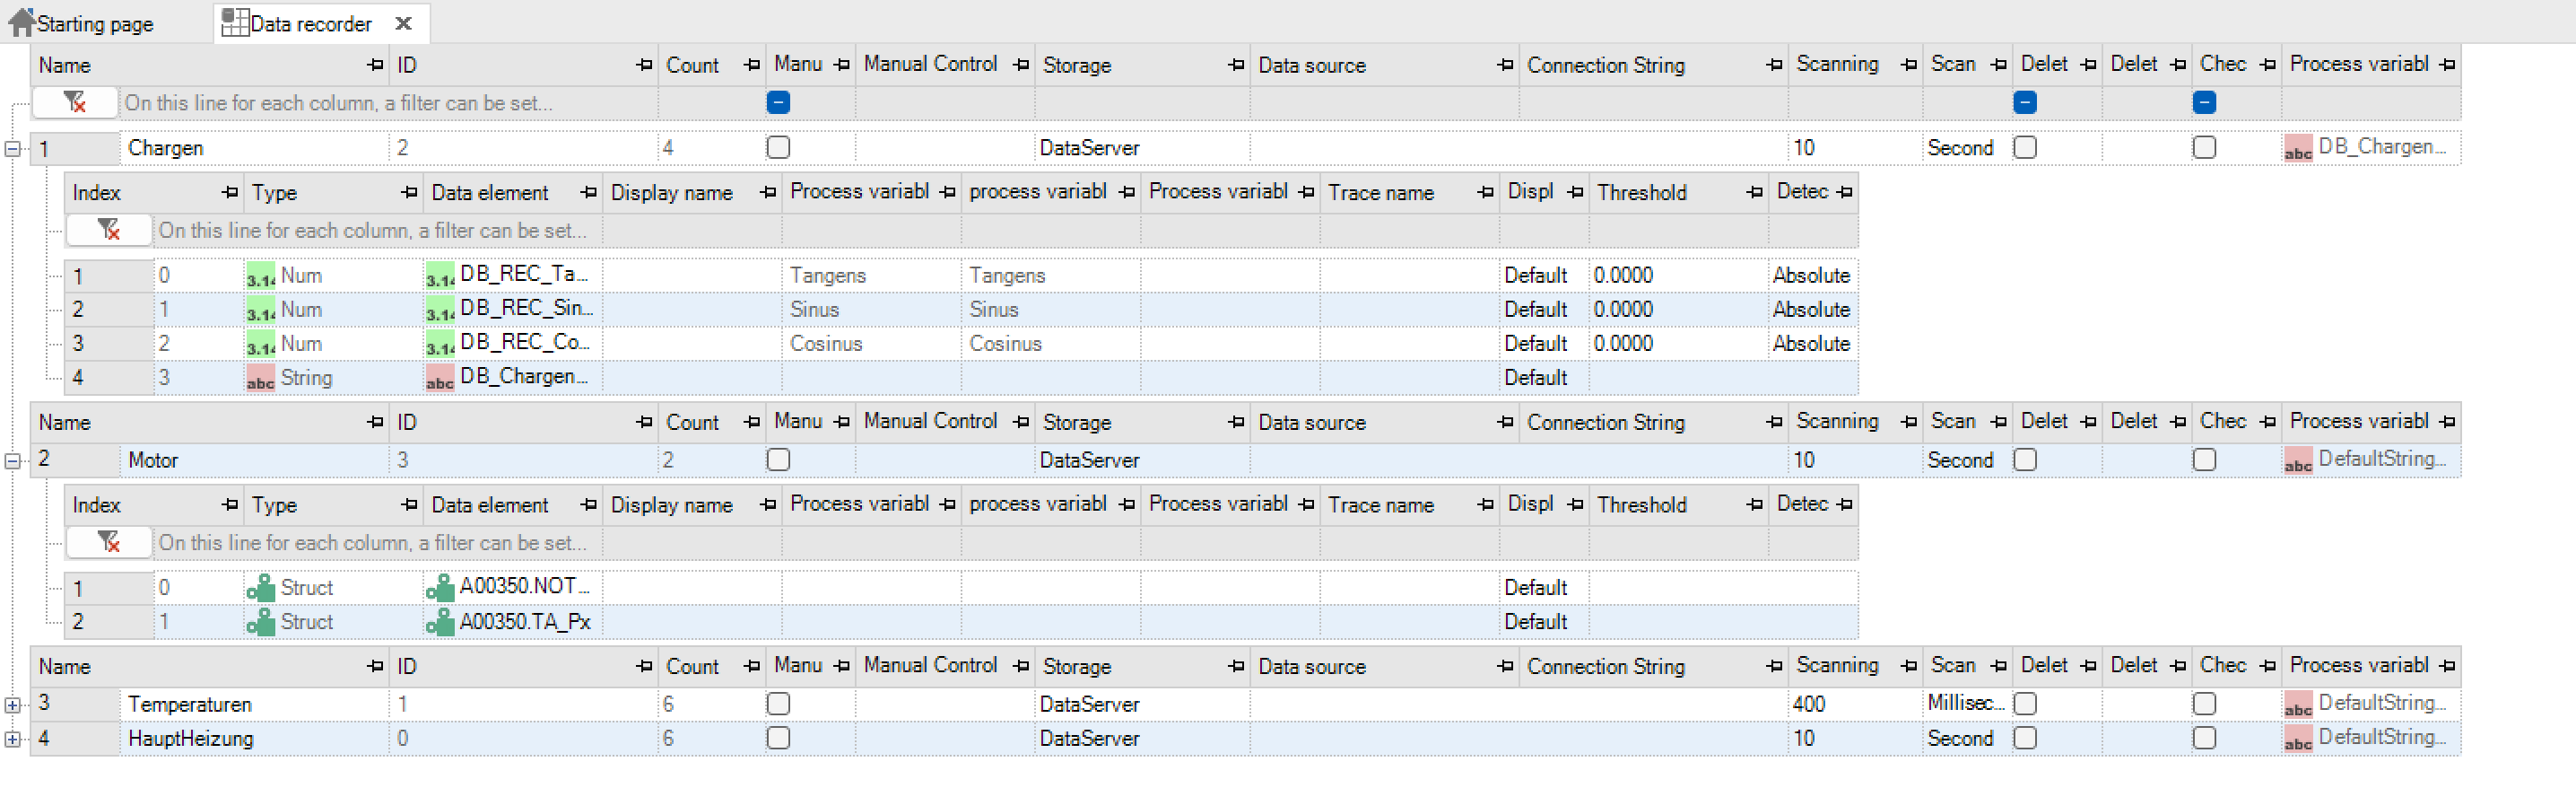
The meaning of the columns is shown in the following tables.
General parameters
Parameter |
Description |
|---|---|
Name |
Name of the data recorder |
ID |
Unique number of the data recorder |
Number |
Number of data items in the data recorder |
Manual recording |
Activates / deactivates the recording of process values via a logical process tag or a function in scripting |
Variable for manual control |
Logical variable for controlling manual recording |
Data storage |
Selection of which “DataServer”, “ODBC connection” or “ODBC (single table)” should be used as data storage. |
Data source |
Selection of an ODBC connection if the “ODBC connection” or “ODBC (single table)” option was selected during data storage |
Sample |
Interval for the value sampling |
Scanning unit |
Unit of the sampling interval. Milliseconds to hours are possible. When scanning in milliseconds, only 100 millisecond steps are possible. |
Buffer size |
Specifies how many records are buffered in the save before the file is saved. |
Average value buffer |
The mean values are formed via the recording buffer and only these are recorded |
Delete after days |
This option will automatically delete the recorder files. |
(only day-oriented files) |
|
Delete after x days |
Specifies the number of days after which the files should be automatically deleted if “Delete after days” is activated. |
Checksum |
Indicates whether the checksum should also be saved |
Variable for batch name |
Specifies the variable whose value specifies the batch name |
Note
The deletion of the daily-oriented files in the ring protocol can only be carried out properly if the PC is running around the clock.

Note
The corresponding text variable must be defined in the data recorder to specify batch names. The corresponding text variable that specifies the batch name is selected via the “Set as batch name” option.
Important
Due to the internal, index-based data structure, it is not possible to delete process variables from the track definition. Deleting variables would lead to an index shift and thus make the data recorder unusable in connection with trends. Therefore, variables can only be deleted from the end if they are not in use.
|
Description |
|---|---|
Index |
Order of the data elements |
Type |
Tag type of the process tag |
Data element |
Process variables whose values are to be recorded |
Display name |
A multilingual display name for the data track can be specified here |
Tag comment |
The comment of the tag is displayed here, cannot be changed here. |
Tag display name |
The display name of the tag is displayed here, it cannot be changed here. |
Tag display comment |
The display comment of the tag is displayed here, cannot be changed here |
Track name |
Optional specification of a name for the data track (table heading) |
Display option |
With the sub-elements of a data record, it is now possible to determine how the display should take place via a selection. The display name of the data recorder element is used by default. If this is not used, the display name of the process variable is displayed. If this is also not set, the process variable name can be seen in the display. |
Determination of change in value |
Defines whether an absolute or percentage change to the last value is defined as the threshold value for data recording |
Threshold |
If the value change of the variable is above this value, a new entry is generated in the data recorder, eg 0.0 means that every change is saved in the database. If the track is in several data recorders, the smallest threshold value that is greater than zero always counts. (this function is only available for numeric variables) |
Important
If a track is in several recorders, the lowest threshold value, which is greater than zero, always applies.
Use of structural elements
Structure elements can also be used in a data recorderPlease note the following:
Only elements of instantiated structures can be selected
The export of the project automatically replaces each structure element with the variables assigned to the instance elements
Special features when scanning in the millisecond range
The sampling time can be set in milliseconds. The minimum sample value is 100 milliseconds and can be increased in steps of one hundred
Cycle time
The standard setting of the cycle time in PROCON-WEB is 50 ms. If loggers with millisecond scanning are used, the cycle time should be a quarter of the set recorder scanning time. For example, if you have defined a sampling time of 100 ms in the data recorder, the cycle time must be set to 25 ms.
The cycle time is under process coupling -> Configuration set.
Use buffer
When recording in the millisecond range, a lot of data is generated that must also be saved on the hard drive. To minimise hard disk access, a correspondingly large buffer should be selected. However, the buffer size should not be selected too high since the data in the buffer will be lost in the event of a system failure. In the case of a logger with classic table storage and a scan of 100 ms, for example, buffer sizes in the range 10 - 50 should be selected so that write access to the hard disk takes place every 1 - 5 seconds.
Important
The recorded values should not be stored in an ODBC data source with a sampling rate that is too low! For example, writing to an SQL database every second can lead to the system being busy after a while due to the amount of data involved.
Important
When using the ODBC data storage, it is not possible to access alternative recording directories!
Create data recorder views
Under the data recorder views, the profiles for a chart are defined based on data recorder tracks.
Create data recorder views
The Views area can be found in the project tree under Data-> Data Recorder.
To create a new view or a new profile, the entry “New Profile” is selected via the context menu. The tracks from any data recorder can then be added to the profile. In addition, the time range can be selected that is to be displayed when opening for the first time.
The Count column contains the number of tracks added to the profile.

Configure data recorder views
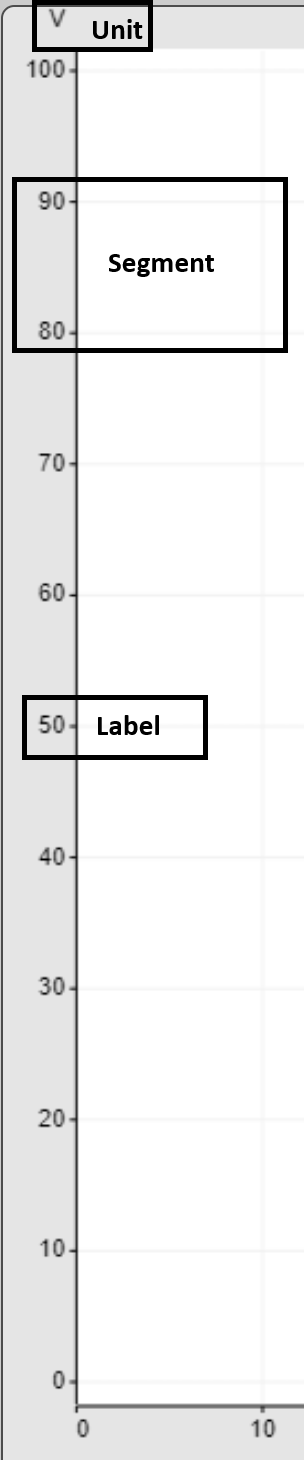
Here, the representation in the chart can be adjusted separately for each track.The axis is divided into several segments. These can be influenced in data recorder views.Both axes can be deactivated in the designer.
The Y-axis has a small free area at the upper and lower edge so that drawn values that lie on the limits of the axis do not lie on the edges of the drawing area.The unit is displayed under the Y-axis if the X-axis is activated. If this is not the case, the unit is added to each axis label.
If there is 0 in the value range of the Y-axis, an additional label is always inserted for this value. If this would overlap another label, only the 0 is displayed.
The following section describes the configuration options in detail.
Parameters for the data elements:
Parameter |
Meaning |
|---|---|
Index |
Order of the data elements |
Type |
Variable type of the data track |
Data element |
Data track that is displayed |
Colour |
Colour of the trace in the chart |
Presentation |
Representation of the trace in the chart |
Logical: |
|
is set, a bar is drawn over this period. If the value is not set (or not a valid value) nothing is displayed. The name of the variable is displayed on the left edge. |
|
variable value is set, a bar is drawn over this period. If the value is not set (or not a valid value) a thin line is drawn |
|
that can be chosen and the wideness adjusted |
|
Numeric: |
|
connected to each other. |
|
are shown as columns. The width of these columns is always the same, ie if the same value has been logged several times in a row, several columns are drawn. |
|
connected to one another. Everything below this line is filled in colour and semi-transparent up to the X-axis |
|
change in value occurs, a vertically line will go upwards, so that the look of a staircase / steps is created. Everything below this line is filled in colour up to the X axis. |
|
connected to one another via curved lines |
|
change in value occurs, a vertically line will go upwards, so that the look of a staircase / steps is created |
|
displayed with a cross. |
|
displayed as a circle. |
|
the start point to the end point of the batch, a semi-transparent, coloured area is displayed over the full height of the chart |
|
Line style |
Representation of the line for numerical values |
Line width |
Line width in pixels for numeric values |
Axis |
Definition on which side the axis should be displayed |
Axis colour |
Colour of the axis for the track in the chart. Axes of the same colour are grouped together if possible |
Logarithm. Presentation |
Specifies whether a logarithmic representation should be selected for the values |
Hide process variable track |
Process variable (Bool) to hide the track |
Highlight the track |
Process variable (Bool) to highlight the track |
Invert axes |
Show axis inverted |
Unit option |
This defines which unit is to be displayed. |
The choices are: |
|
None |
|
of the variable |
|
Custom |
|
Unit |
If the unit option is Custom: Define a unit for the track |
Y-axis autom. scale |
Automatic scaling of the Y-axis. During runtime, the Y-axis adapts dynamically to the largest and smallest value. A division into segments can no longer be made |
Min |
Min value of the axis if the axis is not dynamic |
Max |
Max value of the axis if the axis is not dynamic |
Segments dynamic |
Only if the axis is NOT dynamic: Number of subdivisions of the axis |
Segments fix |
Only if segments are NOT dynamic: Fixed number of subdivisions of the axis, please note that the value 0 means one segment. Negative entries are not permitted. Numbers with decimal places are rounded down to the next lower value |
Variable for segments |
Only if segments are dynamic: Variable via which the number of axis subdivisions is controlled |
Increment |
Only if the axis is dynamic: Minimum increment at the subdivisions |
Fix increment |
Only if step size NOT dynamic: Fixed step size of Axis divisions. Only inputs greater than 0 are allowed. |
Tag for increment |
Only if the increment is NOT dynamic: Fixed increments of the axis subdivisions. Only entries greater than 0 are permitted |
Variable upper limit |
Variable for a upper limit value that is shown in the chart by a dashed line. |
Variable lower limit |
Variable for a lower limit value that is shown in the chart by a dashed line. If there are both limit values, the area between them is filled with the colour of the track. A relatively high level of transparency is used so that the rest is not covered. |
Use decimal places |
Activates / deactivates the attribute |
Decimal places |
Number of decimal places that are displayed. |
XY curves
To be able to use a chart in the “XY diagram” mode (see chapter Curve diagram control), the XY curves must be defined here. XY curves are value arrays that are filled by the controller or via scripting. This means, for example, that the film thickness can be displayed over the width of the film or extremely fast processes (e.g., a press curve) can be recorded by the controller and transferred to the HMI as a data array. With the transfer of arrays with X and Y values, discontinuous curves (e.g., circles) can also be transferred to the chart.
Four different types of XY curves can be defined:
A (standard case): Curves with constant X-distances: All transferred Y-values have the same distance to each other on the X-axis (static value) and start with a fixed X-value and end with a fixed X-value (e.g., film thickness)
B: Curves with X values and a dynamic X distance (the same for all points)
C: Curves with transfer of all coordinates as X and Y values. With this, discontinuous curves (e.g., circles) can be drawn
D: Text overlays: Texts can be positioned within a diagram by means of n instances of a predefined data structure containing X and Y values, as well as a comment with alignment. This type is often used in conjunction with another representation for commenting on it.The configuration of all four curve types is basically similar. The following table describes the individual parameters.
Parameter |
Meaning |
|---|---|
Name |
Name of the curve, must be unique |
Display name |
Display name of the curve, multilingual |
Type |
Type of curve (selection from the four variants) |
Structure |
D only: Selection of a structure instance as an array |
X-values variable |
B: Variable that describes the distance between the values on the X axis |
C: array with all X values |
|
onstant Delta-X value |
only A: X-distance with constant X-distances |
X-axis unit option |
Selection of which type of unit is used: |
Without: No unit is used |
|
Text: as before; language-dependent text on the axis |
|
Unit: Unit from the units defined under “Process communication” |
|
Y-values variable |
Variable array that contains the Y values of the curve (not D) |
Dynamic X range * |
X-range dynamic or constant |
Y-axis unit option |
Selection of which type of unit is used: |
Without: No unit is used |
|
Text: as before; language-dependent text on the axis |
|
Unit: Unit from the units defined under “Process communication” |
|
X-Min. konstant* |
Smallest X value with constant X range |
X min. Variable* |
Variable that contains the smallest X value in a dynamic X range |
X max. constant* |
Largest X value with constant X range |
X max Variable* |
Variable that contains the largest X value in a dynamic X range |
Dynamic Y range * |
Y range dynamic or constant |
Y-Min. constant* |
Smallest Y value with constant X range |
Y-Min. Variable* |
Variable that contains the smallest Y value in the case of a dynamic Y range |
Y-max constant* |
Largest Y value with constant X range |
Y-max. Variable* |
Variable that contains the largest Y value in the case of a dynamic Y range |
Axis break (X-axis) |
Activation of the axis break |
Axis break point constant |
A fixed break point can only be recorded if there is no dynamic X range, ie if the axis has fixed min-max limits |
Axis break point variable |
Es kann nur ein fester Umbruchspunkt ausgewählt werden, wenn ein dynamischer X-Bereich vorhanden ist d.h. wenn die Achse dynamische Min-Max-Grenzen hat |
Refresh variable* |
Tag that triggers a refresh of the diagram when changed (with a positive edge) |
Logarithmic* |
Logarithmic (or normal) display of values |
Unit of measurement X-axis * |
Specification of a unit of measurement for X-axis labelling |
Unit of measurement Y-axis * |
Specification of a unit of measurement for Y-axis labelling |
Number of values |
Variable for the maximum number of data points to be drawn |
* The parameters marked in this way are valid for all curve types!
Unit switchover of the axes
When configuring a new chart profile during runtime, the current unit changeover must be considered when entering the min-max limits. This means that the entry is made in the current unit and is changed when changing.
The value variables of the XY curve must be given the unit separately. Your values are not converted into the current unit.
If a tag that also has a unit is used as the limit value of the axis, the value of the “base unit” is used and translated separately by the axis.If an axis with a break is used, it cannot be scrolled during runtime if it is in the unchanged state. As soon as the view has been zoomed in, it is possible to scroll up to the specified limits, but not beyond.
XY text overlay
To display multi-digit information in the chart, such as the values reached, the array in Defaut_XYChart must be adapted in the project tree under Process coupling> Structures.This structure is then integrated in the point XY curves under “Data” with the type text overlays. The string variable of the associated track is used for this. In addition, the orientation to the turning point can be determined. To do this, one of these values must be written to the corresponding variable:
Value |
Alignment |
|
|---|---|---|
0 |
Centered |
|
1 |
Left |
|
2 |
Left |
up |
3 |
Above |
|
4 |
Right |
up |
5 |
Right |
|
6 |
Right |
Left down |
7 |
Below |
|
8 |
Left |
Left down |
If none of these values are used, the alignment “centered” is used.
XY curve views (only SCADA)
The profiles for a chart are defined based on XY curves under the XY curve views.
Create XY curve views
The Views area can be found in the project tree under Data-> XY Curves.To create a new view or a new profile, the entry “New Profile” is selected via the context menu. Any XY curves can then be added to the profile.
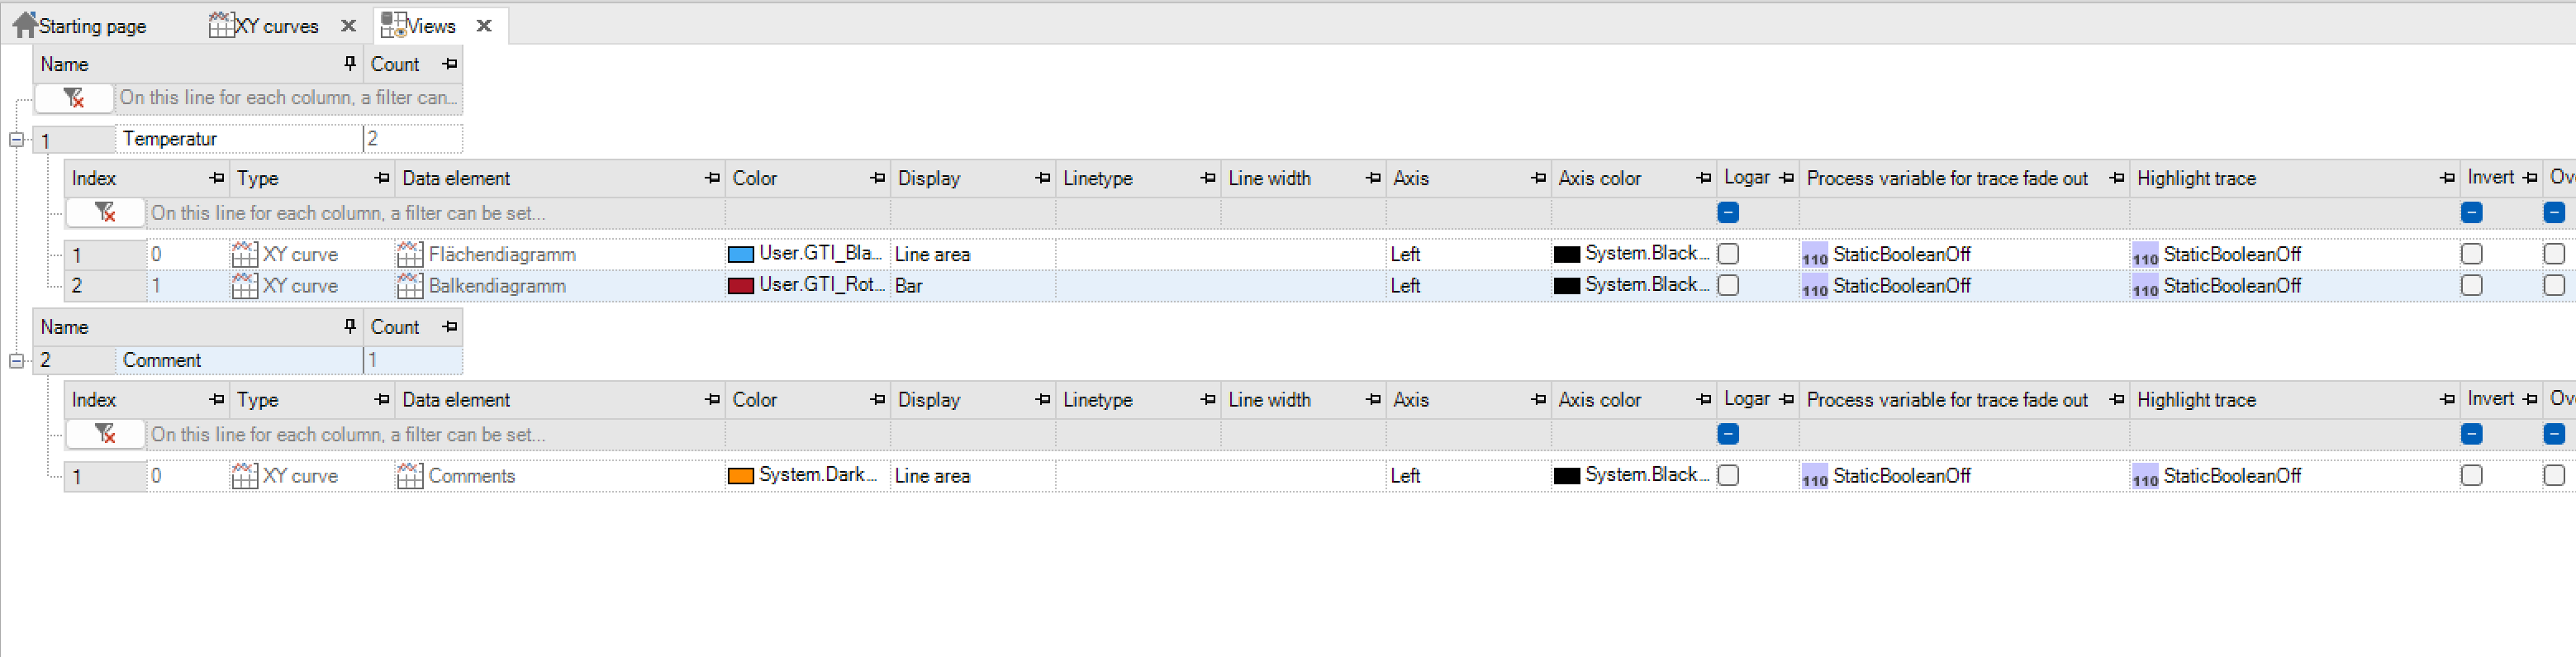
Configure XY curve views
Here, the representation in the XY chart can be adjusted separately for each track. The following section describes the configuration options in detail.
Parameter |
Meaning |
|---|---|
Index |
Order of the data elements |
Type |
XY curve |
Data element |
XY curve of the track |
Colour |
Colour of the trace in the chart |
Process variable upper limit value (X-axis) |
Variable that defines the upper limit of the chart for the X-axis |
Colour upper limit value (X-axis) |
Colour of the upper limit line in the chart |
Process variable löower limit value (X-axis) |
Variable that defines the lower limit of the chart for the X-axis |
Colour variable lower limit value (X-axis) |
Colour of the lower limit line in the chart |
Intermediate area filled (X-axis) |
Selection of whether the area between the limit values should be filled. The colour for this depends on the set track colour |
Presentation |
Representation of the trace in the chart |
The choices are: |
|
Logical: |
|
variable value is set, a bar is drawn over this period. If the value is not set (or not a valid value) nothing is displayed. The name of the variable is displayed on the left edge. |
|
variable value is set, a bar is drawn over this period. If the value is not set (or not a valid value) a thin line is drawn |
|
Numeric: |
|
connected to each other. |
|
are shown as columns. The width of these columns is always the same, ie if the same value has been logged several times in a row, several columns are drawn. |
|
connected to one another. Everything below this line is filled in colour and semi-transparent up to the X-axis |
|
change in value occurs, a vertically line will go upwards, so that the look of a staircase / steps is created. Everything below this line is filled in colour up to the X axis. |
|
connected to one another via curved lines |
|
change in value occurs, the line goes vertically upwards, so that the look of a staircase / steps is created |
|
displayed with a cross. |
|
displayed as a circle. |
|
String: |
|
the start point to the end point of the batch, a semi-transparent, coloured area is displayed over the full height of the chart |
|
Line style |
Representation of the line for numerical values |
Line width |
Line width in pixels for numeric values |
Axis |
Definition on which side the axis should be displayed |
Axis colour |
Colour of the axis for the track in the chart. Axes of the same colour are grouped together if possible |
Logarithm. Presentation |
Specifies whether a logarithmic representation should be selected for the values |
Hide process variable track |
Process variable (Bool) to hide the track |
Highlight the track |
Process variable (Bool) to highlight the track |
Invert axes |
Show axis inverted |
Number of overlays |
Variable for the number of overlays to be drawn (standard curve not included). This is a kind of comparison view to determine deviations from the current values. They are drawn with semi-transparent paint. |
Delete overlays |
Trigger tag for deleting the overlays |
Draw overlays |
Variable for the number of drawn overlays (is written by the chart) |
Note on X / Y array with all coordinates:
The specified array index is used as the starting point for the data used. This means that if you have an array of size 10 and enter the index 5 in the curve configuration, only the last 5 values are displayed in the chart. This works for both the X and Y values.
In combination with the “Number of values” column, an array can be used for several curves.
Example: 10 values from an array of size 50 are to be used for a curve. For this purpose, 5 curves are created, each starting from array index 0, 10, 20, 30, 40 and assigned a (constant -> Min == Max) variable with the value 10 in the number of values.